
AUD/JPY: Volume Profile and Price Action Analysis


Hello guys,

yesterday, I did a video analysis on the EUR/USD. If you missed it, then you can watch it here:

EUR/USD: Volume Profile, Order Flow, and Price Action Analysis

Today, I would like to have a closer look at the AUD/JPY.

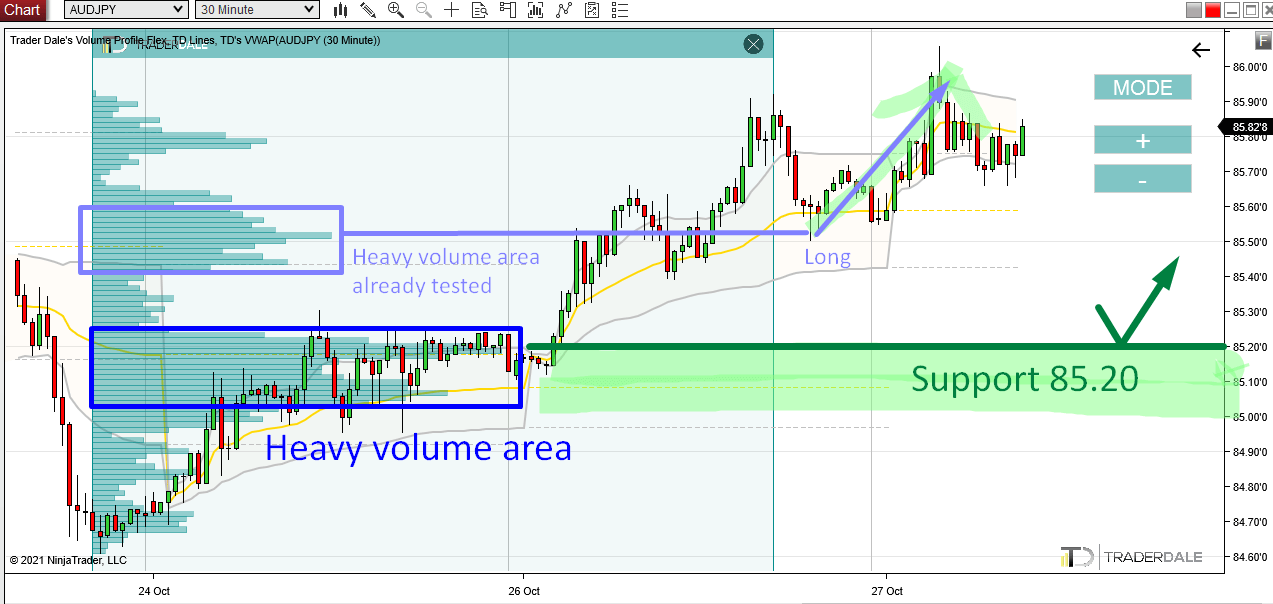
Since Monday, there has been an uptrend on AUD/JPY. When there is a trend I always like to trade pullbacks to heavy volume zones.

What I do is I use my Flexible Volume Profile and use it on the whole trend area. This nicely reveals the most important institutional trading zones. Those are the ones where the Volume Profile is the widest = heavy volume areas.

The price tends to react to those heavy volume areas – they work as strong Support/Resistance zones.

Why they work as S/R zones? Because the BIG guys (institutional traders) who were trading there in the first place defend those zones. They placed heavy volumes there before and this tells us that those zones are important for them. That’s why they defend them (by pushing price away from them) and why they work as strong Support/ Resistance zones.

Supports on AUD/JPY

There are two such heavy volume zones on AUD/JPY.

The first one around 85.50 got already tested and there was a nice reaction to it.

However, there is also a second heavy volume zone around 85.20 and this hasn’t been tested yet. This means it should work as a Support. The same way the zone around 85.00 did.

When the price makes it back to 85.20 I expect the BIG guys to defend this zone and to push the price upwards from there again.

AUD/JPY; 30 Minute chart:
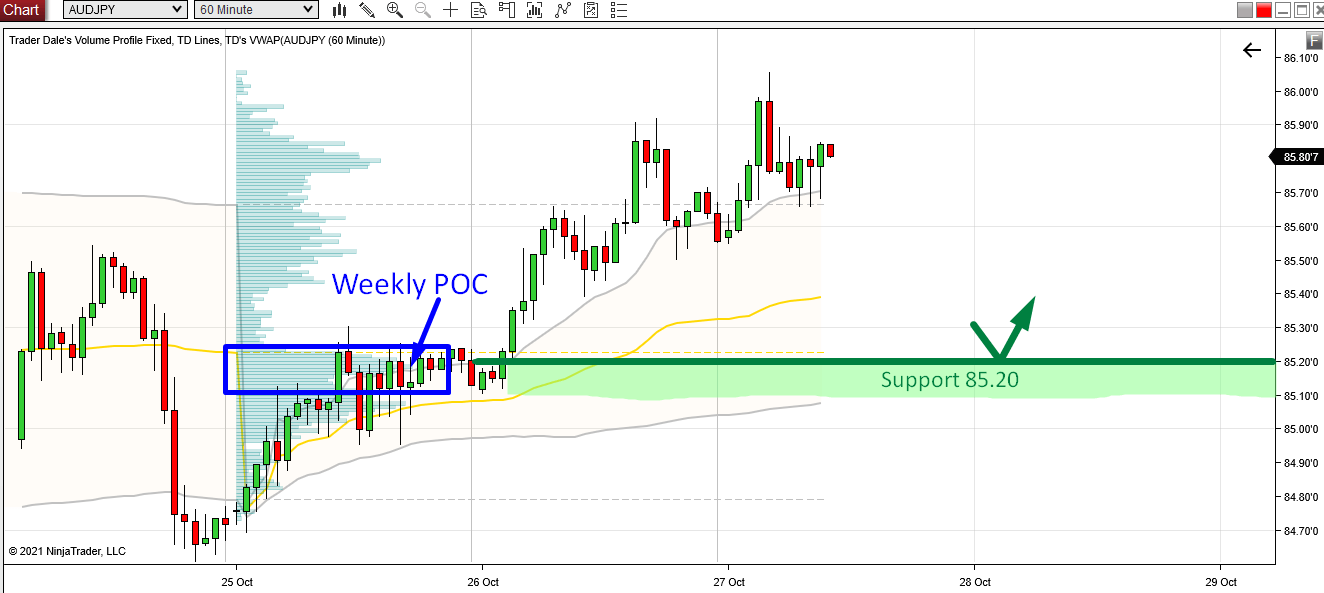
Weekly POC

Another thing I like about the 85.20 area is that it is a Weekly Point Of Control (POC). This means that the heaviest volumes throughout this week (so far) have been traded there.

This is just by itself a very important level to be aware of.

AUD/JPY; 60 Minute chart:

I hope you guys liked my analysis! Let me know what you think in the comments below!

Happy trading,

-Dale

P.S. The setup I used here is one of my favorite Volume Profile setups called the “Trend Setup“. You can learn all there is about it in my Volume Profile trading course.

Comments

Popular posts from this blog

Bitcoin is Dropping Hard! Here’s Where Smart Money Will Buy Again

Video Transcript: Hello everyone, it’s Dale here. In today’s video, I’d like to talk about Bitcoin. The reason is that Bitcoin has been dropping like crazy, and a lot of traders are wondering where Bitcoin will go and what to expect. If I look at the chart and use Volume Profile, I would say that it’s pretty straightforward because Volume Profile very clearly shows the strongest support and resistance levels. So, let’s take a look at the chart, and let me show you. What you see before you is the daily chart of Bitcoin. This is the big picture, and as you can see, from the all-time high here, Bitcoin experienced quite a significant sell-off and is currently dropping. Right now, I don’t really see any strong support that would stand in the way of this strong sell-off. Let me use Volume Profile and show you what could actually stop the sell-off of Bitcoin. All right, so what I’m going to do is apply Volume Profile over this whole area to see the volume distribution. As you can see, there ...

Quick In & Out Trade on USD/JPY – Smart Money Concepts & Volume Profile

Video Transcript: Hello everyone, it’s Dale here. Welcome to the next video of the new series, where I’ll talk about my recent trades. Today’s trade is on the  USD/JPY . It was a very quick in-and-out trade, so let’s check it out. What you see before you is the 30-minute chart of the  USD/JPY , and the level I was trading from was this short level at  149.63 . The reasoning behind this level—let me zoom in a little so you can see this better—was the volumes that formed here. From this place, there was a sharp sell-off. Even though the volumes do not particularly stand out, what’s important is that from this zone, there was a strong sell-off. There was also a  Fair Value Gap . My software highlights that, but when the gap is filled, it’s not highlighted anymore. If I mark it for you, this was the Fair Value Gap, which is a setup from Smart Money Concepts. I like to trade from the beginning of the Fair Value Gap, which is here. This is also the beginning of a heavy vol...

ORDER FLOW: How to Trade the Absorption Setup (Trade Entry Confirmation)

Video Transcript: Hello everyone, and in this video, I’d like to talk about order flow and one of my favorite confirmation setups in order flow. The confirmation setup is called the absorption, and I’ll show you an example of a trade I made a couple of days ago. I think this is the perfect example of how you can use the absorption setup to confirm your trade entry. So, let’s take a look at it. First, let me start by showing you the level I wanted to trade, and then I’ll show you the absorption setup. You’re looking at the  EUR/USD  30-minute chart, and I had a long level here, marked by this line. This was a long level based on a Volume Profile setup, focusing on those heavy volumes formed within this important rejection. So, this was the long level. What happened was that the price started to go into a sudden sell-off, and there wasn’t really any strong macro news behind this. I wasn’t really sure what was going on, but there was this sudden sell-off, this spike move. Because...