
Today’s intraday analysis will be on NZD/CHF and I will start by talking about the structure of the Weekly Volume Profile.
Weekly Volume Profile structure
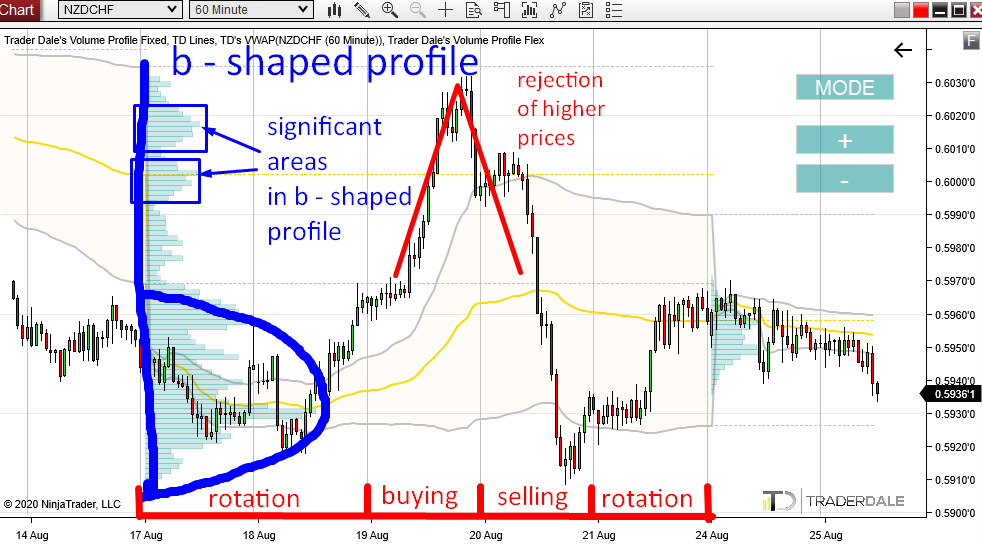
In the previous week, there was a “b – shaped” Volume Profile histogram formed.
b – shaped histogram means that the shape of the histogram looks like the letter “b”.
It says that the market sees the value at the bottom half of the profile while rejecting the upper half.
If you look at the picture below, you can see that there was a rotation (Monday, Tuesday), then strong buying activity (Wednesday), and then an immediate rejection and a sell-off (Thursday). Then again a rotation on Friday.
One of the most important things to notice in a b – shaped profile is a volume cluster created in the rejection area.
In this case, there were two of them.
Such a volume cluster indicates a place where the sellers were massively adding to their short positions. Their intention was to reject the higher prices and push the price lower.
When the price reaches such an area (volume cluster) in the future again, then it is likely that those sellers will want to defend this area and push the price downwards again.
Below is a 60 Minute chart of NZD/CHF and a Weekly Volume Profile:
Do you want ME to help YOU with your trading?
Join one of my Volume Profile Educational courses and get my private trading levels, 15 hours of video content, my custom made Volume Profile indicators, and more!
So, in this case, the strong resistance should be at one of those volume clusters I marked above.
Volume Cluster at 0.6000
Let’s now have a look some more into the first volume cluster.
In this case, I used 30 Minute chart and a Flexible Volume Profile to see more detail.
It shows that the heaviest volume peak (a local POC) in this volume cluster was at 0.6000 (btw. nice round number). From this place a strong sell-off started.
I think this is the place where the sellers were adding massively to their short positions before the aggressive selling activity started.
Because of this, I believe that the 0.6000 will work as a resistance in the future. I think that when the price hits this area again then the strong sellers there will become active once again and that they will start another selling activity. This selling activity would push the price downwards.
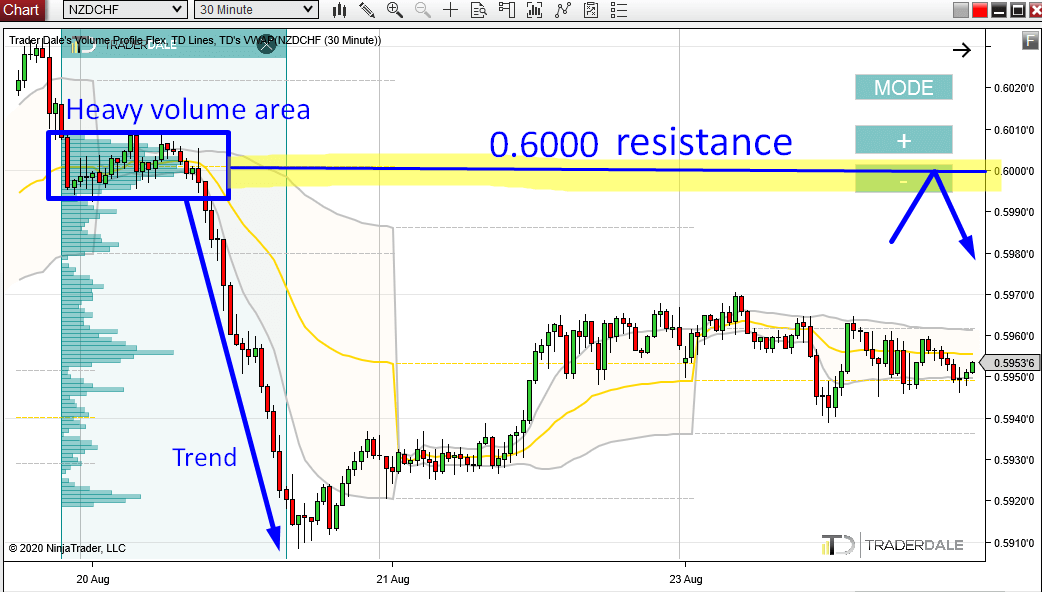
I like the first volume cluster (0.6000) more than the higher one because the strongest sell-off started from there. This is why I think the price is likely to react there.
I hope you guys liked today’s analysis. Let me know what you think in the comments below!
Happy trading!
-Dale

- Get link
- X
- Other Apps
- Get link
- X
- Other Apps
Comments
Post a Comment