
EUR/CHF: Volume Profile and Price Action Analysis


Hello guys,

today, I am going to talk about EUR/CHF.

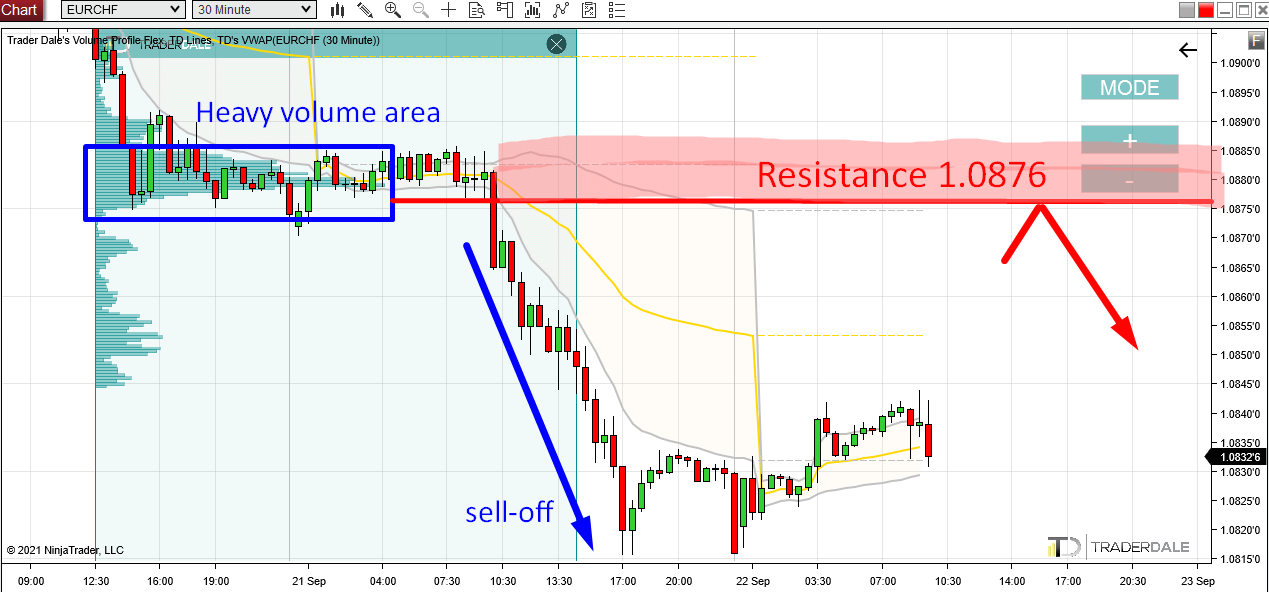
The thing that caught my eye was a tight price channel/rotation from which a strong sell-off started.

What usually happens in such rotation is that BIG institutional traders are building up their huge trading positions.

They do it in a rotation so they are not recognized and their intentions stay hidden.

What those BIG guys do next is they start a trend. This is where their trades start making money.

In this case, it was a downtrend (a sell-off).

This tells us that the BIG guys who were building up their trading positions were strong Sellers.

You can see those big trading positions using my Volume Profile indicator. It nicely reveals the institutional trading activity within the rotation area.

EUR/CHF, 30 Minute chart:

What the Volume Profile Tells Us?

What we have now is this information: There were strong institutional Sellers building up their Shorts in a heavy volume area starting around 1.0876.

This is an useful piece of information we can work with.

When the price makes it back into this heavy volume area, then those strong Sellers will most likely want to defend this zone. It is clearly important for them because they placed a lot of their Short trades there.

Also, potential Buyers will be aware of this heavy volume zone and would not want to risk a possible fight with strong institutional Sellers there (around 1.0876).

So, what they will do when the price reaches the 1.0876 area? They will start quitting their Long trades. To quit a Long trade, they will need to Sell, and a Market Sell Order will help to push the price downwards again.

Both these factors (Sellers defending, and Buyers getting rid of Longs) should work together around the 1.0876 area and make this zone a strong Resistance.

The Volume Profile setup I used here is called the “Volume Accumulation Setup“.

I hope you guys liked my analysis! Let me know what you think in the comments below!

Happy trading,

-Dale

Comments

Popular posts from this blog

Bitcoin is Dropping Hard! Here’s Where Smart Money Will Buy Again

Video Transcript: Hello everyone, it’s Dale here. In today’s video, I’d like to talk about Bitcoin. The reason is that Bitcoin has been dropping like crazy, and a lot of traders are wondering where Bitcoin will go and what to expect. If I look at the chart and use Volume Profile, I would say that it’s pretty straightforward because Volume Profile very clearly shows the strongest support and resistance levels. So, let’s take a look at the chart, and let me show you. What you see before you is the daily chart of Bitcoin. This is the big picture, and as you can see, from the all-time high here, Bitcoin experienced quite a significant sell-off and is currently dropping. Right now, I don’t really see any strong support that would stand in the way of this strong sell-off. Let me use Volume Profile and show you what could actually stop the sell-off of Bitcoin. All right, so what I’m going to do is apply Volume Profile over this whole area to see the volume distribution. As you can see, there ...

Beginners Guide to Order Flow PART 1: What Is Order Flow?

DEFINITION: Order Flow is an advanced charting software which enables you to read all trading orders that are processed in the market. It helps to track the BIG financial institutions through the trades they make. Most people get confused when they open up a chart with Order Flow for the first time. There is no shame in that. Order Flow shows so many information and it is easy to get overwhelmed and confused if you don’t know what to look for! This Beginners Guide will teach you how to understand how Order Flow works and how you can use it in your trading! In this 1st part of the Order Flow Guide I will show you around the Order Flow interface. Footprints The Order Flow does not show standard candles, but it shows FOOTPRINTS . A footprint shows not only Open, High, Low, Close (as standard candles) but it also shows orders traded in that candle. Orders can be...

Quick In & Out Trade on USD/JPY – Smart Money Concepts & Volume Profile

Video Transcript: Hello everyone, it’s Dale here. Welcome to the next video of the new series, where I’ll talk about my recent trades. Today’s trade is on the  USD/JPY . It was a very quick in-and-out trade, so let’s check it out. What you see before you is the 30-minute chart of the  USD/JPY , and the level I was trading from was this short level at  149.63 . The reasoning behind this level—let me zoom in a little so you can see this better—was the volumes that formed here. From this place, there was a sharp sell-off. Even though the volumes do not particularly stand out, what’s important is that from this zone, there was a strong sell-off. There was also a  Fair Value Gap . My software highlights that, but when the gap is filled, it’s not highlighted anymore. If I mark it for you, this was the Fair Value Gap, which is a setup from Smart Money Concepts. I like to trade from the beginning of the Fair Value Gap, which is here. This is also the beginning of a heavy vol...