
USD/CAD: Swing Trading Analysis With Volume Profile


Hello guys,

today’s post will be a Swing trade analysis of USD/CAD.

With Swing trades, I do my analysis mostly using Daily charts. This allows me to see the bigger picture.  I need the bigger picture to see what the BIG trading institutions do on the higher time frames.

With Swing trades, I also use way wider Take Profits and Stop Losses than with day trading levels.

What caught my eye on the USD/CAD was a strong downtrend that started in April and continues until now.

USD/CAD: Volume Profile Analysis

With a trend like this, I am always interested in how the volumes were distributed there – within the trend area. For this I use my Flexible Volume Profile indicator. I simply drag it over the whole trend area – like in the picture below.

USD/CAD; Daily chart:

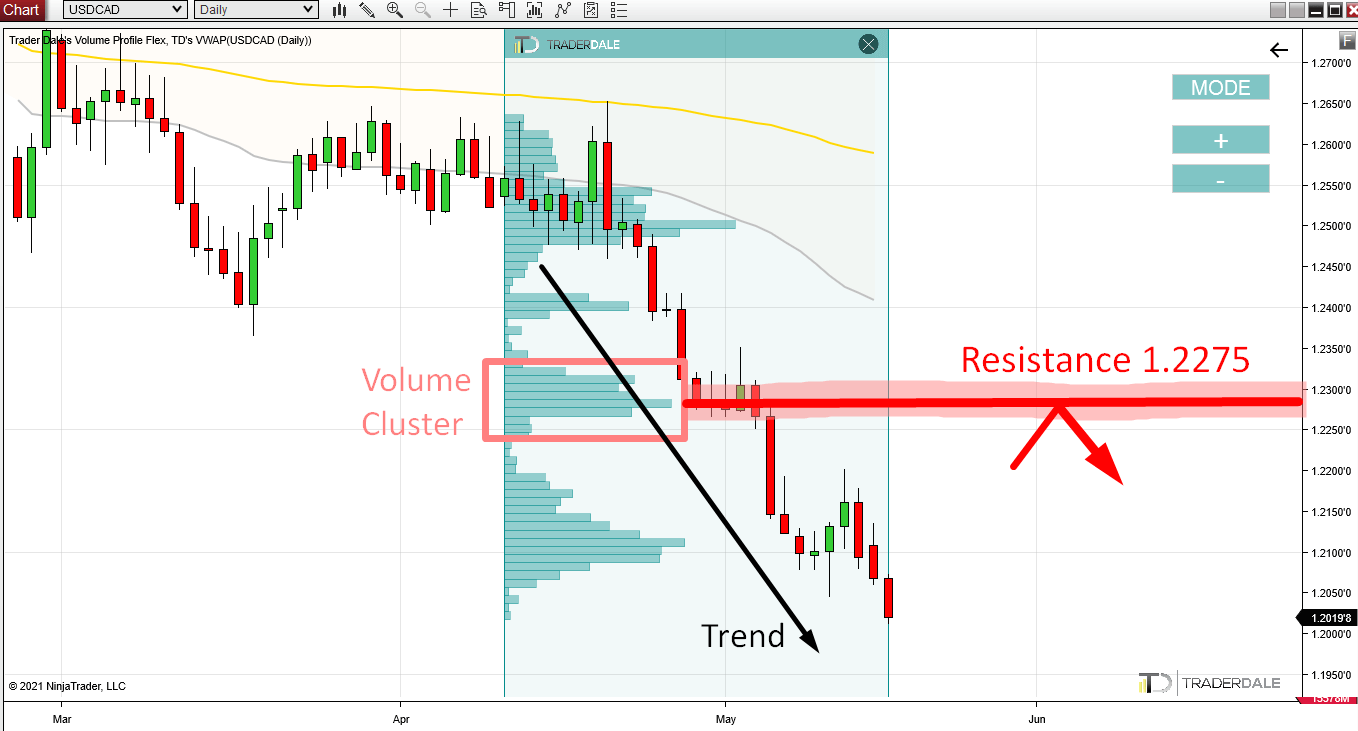
As you can see from the picture, there is a couple of “volume bumps” which I call the Volume Clusters. Those Volume Clusters represent places where heavy volumes were traded. I am always after the heavy volumes because heavy volumes = Big institutions.

In the picture above I selected a Volume Cluster around 1.2275. Heavy volumes were traded there and then, after a couple of days, the sell-off continued.

It seems that the BIG institutions were adding to their Short positions in that Volume Cluster. Then they pushed the price downwards again.

When the price makes it back into the 1.2275 area it is pretty likely that those strong institutional Sellers will want to defend this zone. It is an important zone for them since they placed a lot of their new Shorts there.

So, what I think will happen is that they will want to push (manipulate) the price downwards from this place again. This is why I think this will make the area around 1.2275 a strong Resistance.

I call this setup the “Trend Setup“. I trade it when there is a trend.

Do you want ME to help YOU with your trading?

Join one of my Volume Profile Educational courses and get my private trading levels, 15 hours of video content, my custom made Volume Profile indicators, and more!

If you would like to learn more about Swing trading, then you may want to check this webinar recording:

WEBINAR: Swing Trading With Volume Profile

I hope you guys liked today’s analysis! Let me know what you think in the comments below.

Happy trading,

-Dale

Comments

Popular posts from this blog

Beginners Guide to Order Flow PART 1: What Is Order Flow?

DEFINITION: Order Flow is an advanced charting software which enables you to read all trading orders that are processed in the market. It helps to track the BIG financial institutions through the trades they make. Most people get confused when they open up a chart with Order Flow for the first time. There is no shame in that. Order Flow shows so many information and it is easy to get overwhelmed and confused if you don’t know what to look for! This Beginners Guide will teach you how to understand how Order Flow works and how you can use it in your trading! In this 1st part of the Order Flow Guide I will show you around the Order Flow interface. Footprints The Order Flow does not show standard candles, but it shows FOOTPRINTS . A footprint shows not only Open, High, Low, Close (as standard candles) but it also shows orders traded in that candle. Orders can be...

5 Character Traits of a Successful Trader – Tips & Tricks of the Pros!

 Maybe you are interested in trading, and you have taken the first step by researching on forex trading. You might also be currently trading but going through a tough time with your results in the markets and dealing with the recurrent autosuggestion, telling you how this journey might not be for you or you are not capable of achieving successes in this journey. It is essential to know that you are not alone in this feeling, and before you fall into the rabbit hole of depression, feeling like a failure in yet another skill you have chosen. Let me make it clear; the answer is YES, anyone can achieve success in trading , including you. It would only cost you a few character trait adjustments. Before we delve in, it is vital to point out that success i...

Quick In & Out Trade on USD/JPY – Smart Money Concepts & Volume Profile

Video Transcript: Hello everyone, it’s Dale here. Welcome to the next video of the new series, where I’ll talk about my recent trades. Today’s trade is on the  USD/JPY . It was a very quick in-and-out trade, so let’s check it out. What you see before you is the 30-minute chart of the  USD/JPY , and the level I was trading from was this short level at  149.63 . The reasoning behind this level—let me zoom in a little so you can see this better—was the volumes that formed here. From this place, there was a sharp sell-off. Even though the volumes do not particularly stand out, what’s important is that from this zone, there was a strong sell-off. There was also a  Fair Value Gap . My software highlights that, but when the gap is filled, it’s not highlighted anymore. If I mark it for you, this was the Fair Value Gap, which is a setup from Smart Money Concepts. I like to trade from the beginning of the Fair Value Gap, which is here. This is also the beginning of a heavy vol...