
GOLD: Market Profile and Price Action Analysis


GOLD: Market Profile and Price Action Analysis

Hello guys,

yesterday we did a Swing trade analysis on USD/CAD. If you missed it then you can check it out here:

USD/CAD: Volume Profile and Price Action Swing Analysis

Today, I am also going to do a Swing trading analysis. This time on Gold!

As I wrote in the yesterday’s post, I do my Swing trade analysis using mostly Daily time frame. Today, I also used 4-Hour time frame.

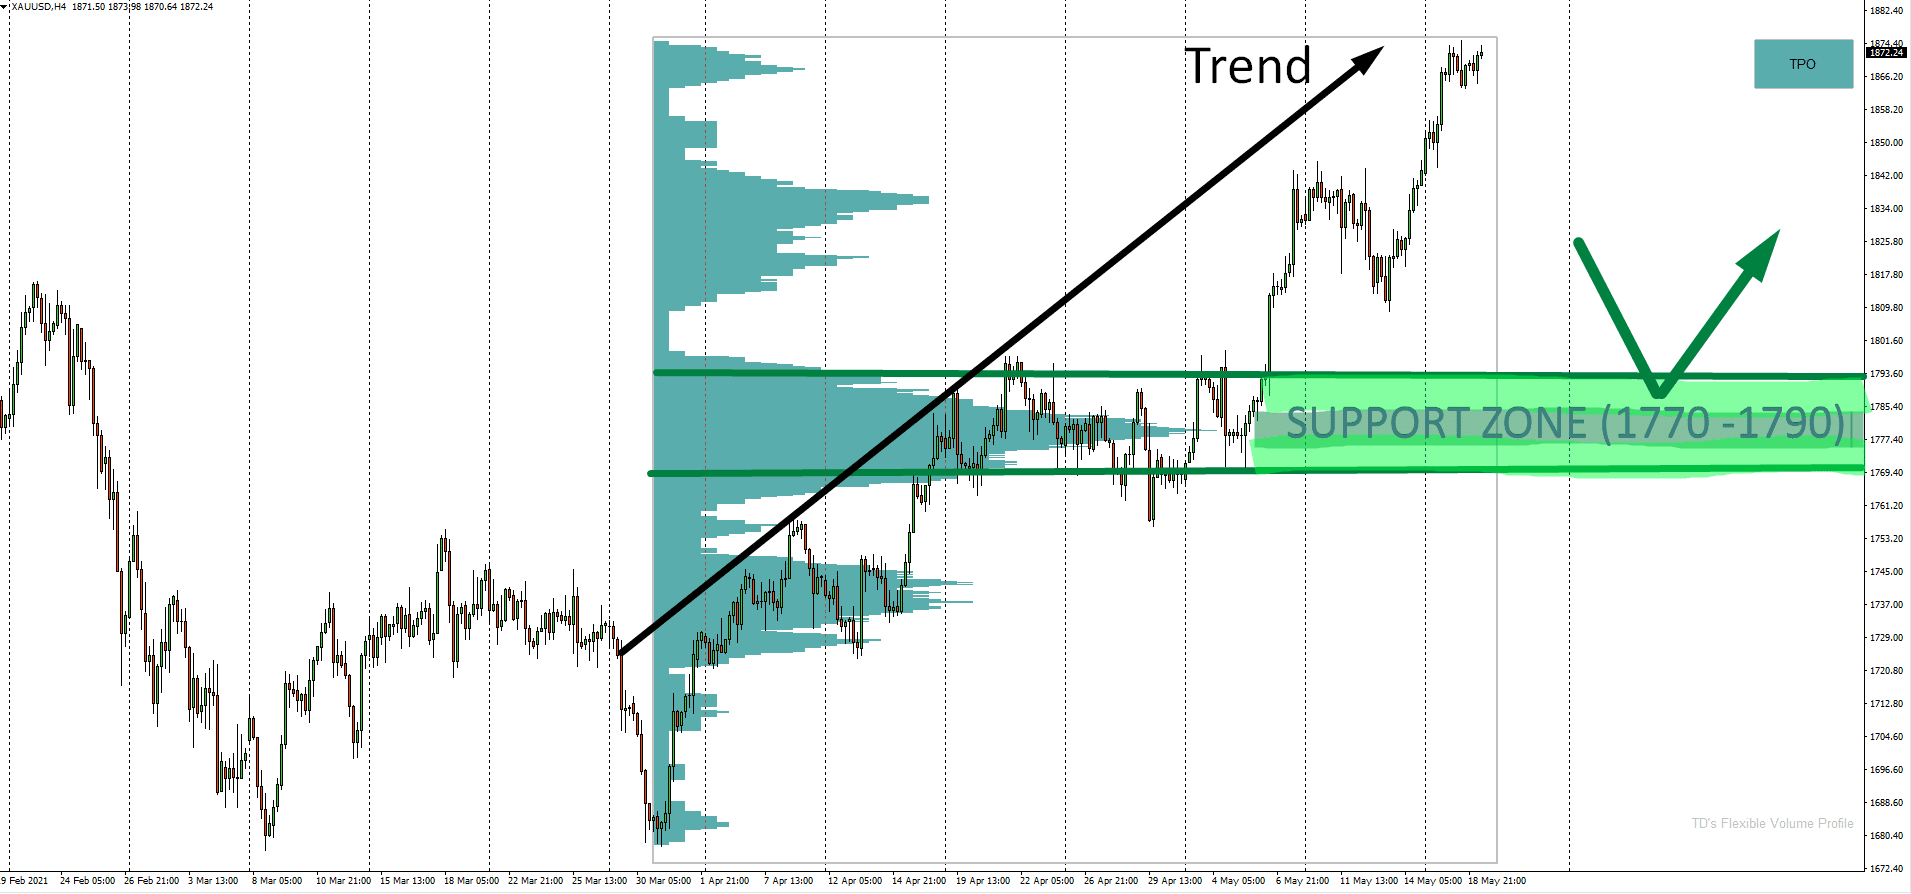
What initially caught my eye on Gold was the newly formed uptrend that has been on Gold since the start of this month. Big trading institutions are clearly pushing the price of Gold upwards.

GOLD: Volume Profile Analysis

I used my Volume Profile (MT4 Volume Profile) to look into the current uptrend. The Profile showed a significant volume area around 1170 – 1790.

Gold (XAUUSD); 4-Hour time frame:

This is a valuable information because it tells us that strong Buyers used this zone to add to their Long positions. Then they pushed the price even higher.

Even though the price has already left this zone and it is moving above it, this zone is still important. It is so because strong Buyers placed a lot of their Longs there.

If the price comes back, then those Buyers will mostly want to use this zone again – to add to their Longs and to push the price up again.

This is why it should work as a strong Support. Now we just need to wait for a pullback.

The setup I used is called the “Trend Setup“. I like to trade it when there is a trend.

Daily Time Frame

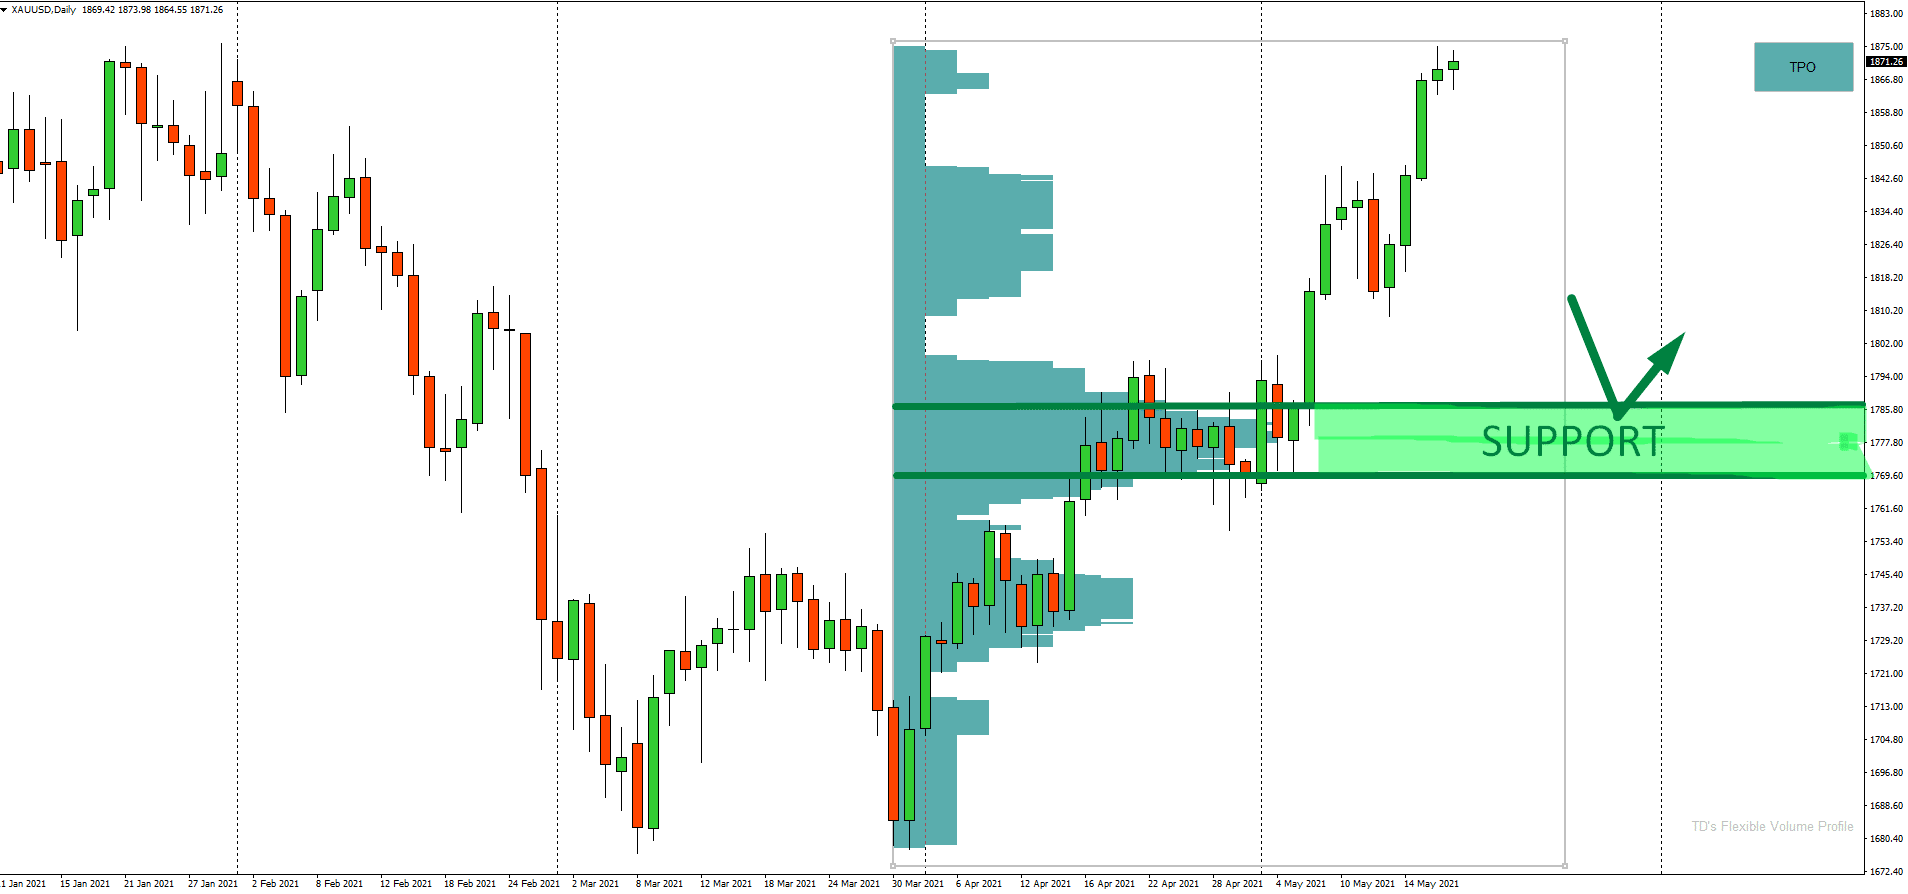
The whole situation is maybe a bit easier to read on a Daily chart. The reason I used 4 Hour chart is that I used TPO Profile. TPO profile is always more detailed and precise if you use it on a faster time frame.

Below is the same situation on a Daily time frame:

If you want to know what is the difference between Volume Profile and TPO (Market Profile) then check out this video:

Volume Profile vs. Market Profile – What Is The Difference?

I hope you guys liked today’s Swing trade analysis! Let me know what you think in the comments below!

Happy trading,

-Dale

Do you want ME to help YOU with your trading?

Join one of my Volume Profile Educational courses and get my private trading levels, 15 hours of video content, my custom made Volume Profile indicators, and more!

Comments

Popular posts from this blog

Bitcoin is Dropping Hard! Here’s Where Smart Money Will Buy Again

Video Transcript: Hello everyone, it’s Dale here. In today’s video, I’d like to talk about Bitcoin. The reason is that Bitcoin has been dropping like crazy, and a lot of traders are wondering where Bitcoin will go and what to expect. If I look at the chart and use Volume Profile, I would say that it’s pretty straightforward because Volume Profile very clearly shows the strongest support and resistance levels. So, let’s take a look at the chart, and let me show you. What you see before you is the daily chart of Bitcoin. This is the big picture, and as you can see, from the all-time high here, Bitcoin experienced quite a significant sell-off and is currently dropping. Right now, I don’t really see any strong support that would stand in the way of this strong sell-off. Let me use Volume Profile and show you what could actually stop the sell-off of Bitcoin. All right, so what I’m going to do is apply Volume Profile over this whole area to see the volume distribution. As you can see, there ...

Quick In & Out Trade on USD/JPY – Smart Money Concepts & Volume Profile

Video Transcript: Hello everyone, it’s Dale here. Welcome to the next video of the new series, where I’ll talk about my recent trades. Today’s trade is on the  USD/JPY . It was a very quick in-and-out trade, so let’s check it out. What you see before you is the 30-minute chart of the  USD/JPY , and the level I was trading from was this short level at  149.63 . The reasoning behind this level—let me zoom in a little so you can see this better—was the volumes that formed here. From this place, there was a sharp sell-off. Even though the volumes do not particularly stand out, what’s important is that from this zone, there was a strong sell-off. There was also a  Fair Value Gap . My software highlights that, but when the gap is filled, it’s not highlighted anymore. If I mark it for you, this was the Fair Value Gap, which is a setup from Smart Money Concepts. I like to trade from the beginning of the Fair Value Gap, which is here. This is also the beginning of a heavy vol...

ORDER FLOW: How to Trade the Absorption Setup (Trade Entry Confirmation)

Video Transcript: Hello everyone, and in this video, I’d like to talk about order flow and one of my favorite confirmation setups in order flow. The confirmation setup is called the absorption, and I’ll show you an example of a trade I made a couple of days ago. I think this is the perfect example of how you can use the absorption setup to confirm your trade entry. So, let’s take a look at it. First, let me start by showing you the level I wanted to trade, and then I’ll show you the absorption setup. You’re looking at the  EUR/USD  30-minute chart, and I had a long level here, marked by this line. This was a long level based on a Volume Profile setup, focusing on those heavy volumes formed within this important rejection. So, this was the long level. What happened was that the price started to go into a sudden sell-off, and there wasn’t really any strong macro news behind this. I wasn’t really sure what was going on, but there was this sudden sell-off, this spike move. Because...