
Do you
guys care to trade something bit more “exotic”? I am personally not much
into day trading such pairs as USD/SEK because of big spreads and worse
liquidity.
But with swing trading and long-term investing it is a whole different story. The reason is that with longer-term trades spreads don’t play such an important role. The same goes for liquidity.
So, let’s now have a look at swing trading analysis of USD/SEK!
What caught my eye here was a strong downtrend which started in March. Within this downtrend, there was a rotation in June. In this rotation, there were pretty massive volumes traded. I identified that using my Flexible Volume Profile on the whole trend area.
From this rotation, the downtrend continued. This means that the volumes accumulated in this rotation were mostly sellers entering more short positions and then making another push.
For this reason, it is likely that when the price makes it back into this strong volume zone again, those sellers should become active again and they should start defending their short positions (with aggressive selling activity).
This should drive the price downwards again from there. And that’s why I think this area with POC around 9.3000 will work as a strong long-term resistance.
USD/SEK, Daily chart:
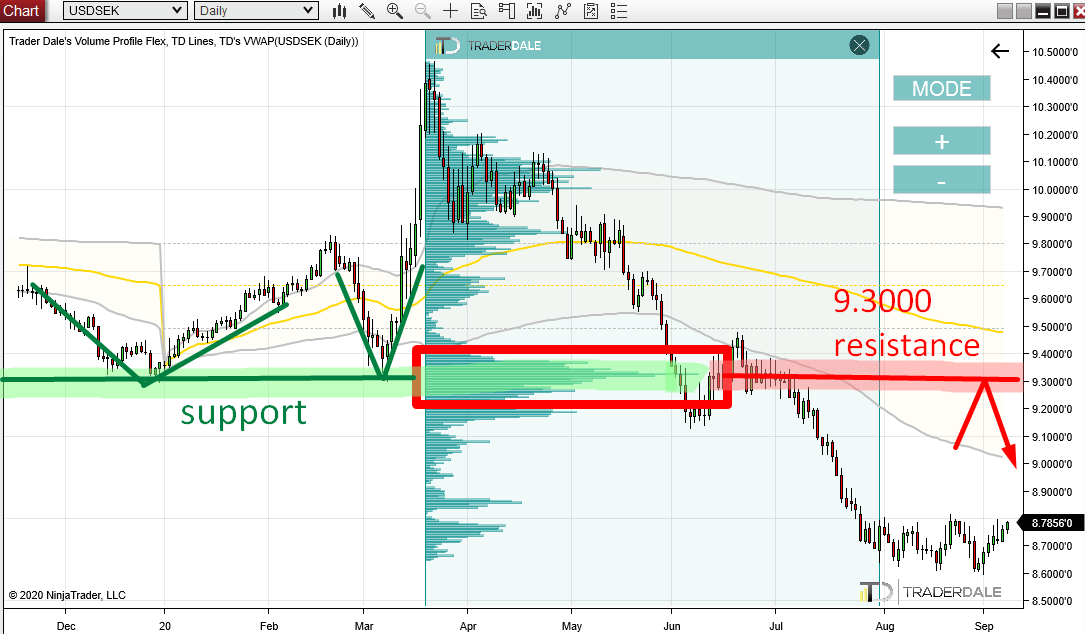
Price Action analysis
If you look at the picture above, you can see how nicely the price reacted to the 9.3000 zone in the past. There were two really strong rejections in December and in March.This tells us, that this zone worked as a strong support. When the price made it past this support in July, then this support turned into a resistance.
This is an old and simple Price Action setup, and you can read more about it here:
Price Action Setup: Support Becomes a Resistance
So, not only we have the volume-based setup (the Trend Setup), but we also have a Price Action setup at the same level. Both those setups point to the same place (9.3000) which is telling us that there is a strong resistance.
Do you want ME to help YOU with your trading?
Join one of my Volume Profile Educational courses and get my
private trading levels, 15 hours of video content, my custom made Volume
Profile indicators, and more!
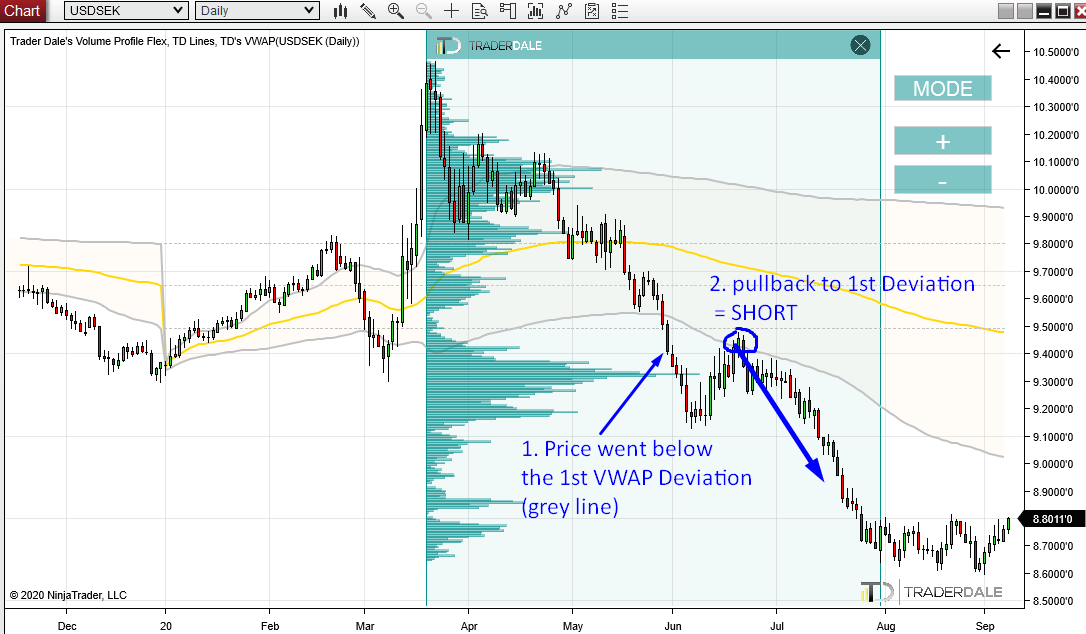
BONUS: VWAP Trend Setup
There is one more thing which is not really related to the analysis above, but I would like show it to you.It is a VWAP Trend Setup which I like to trade.
This setup formed when the price went below the 1st VWAP Deviation and hit it from below. Based on this VWAP Trend Setup, this was a signal to go short.
You can learn more about this setup here:
VWAP Trend Setup
Check out how nicely the price reacted to it:
That’s it for today’s analysis guys. I hope you liked it. Let me know what you think in the comments below!
Happy trading!
-Dale
Happy trading!
-Dale
- Get link
- X
- Other Apps
- Get link
- X
- Other Apps
Comments
Post a Comment