
Today, I am going to do a day trading analysis of the AUD/CHF. What I like about this pair is that there is a clear and strong uptrend (starting from 26th August).
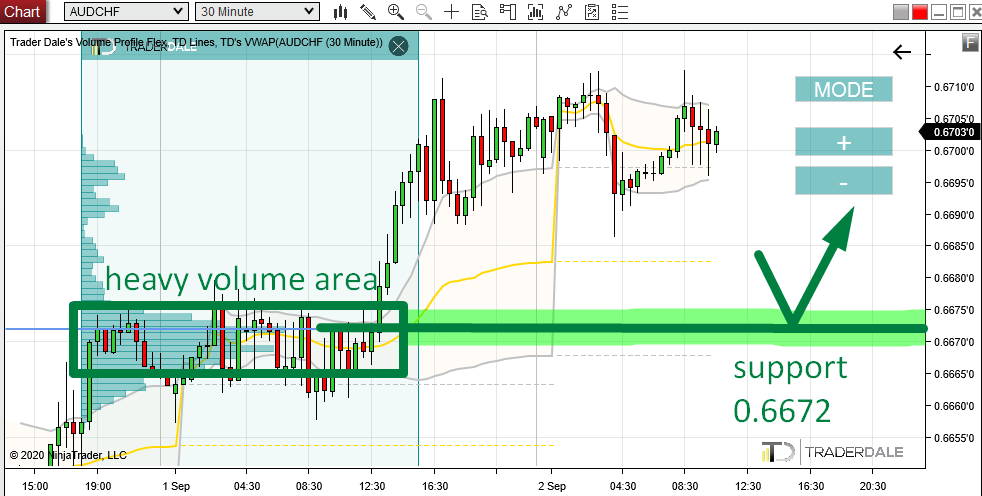
When there is an uptrend like this, I like to look for areas where heavy volumes were traded. I do this with my Flexible Volume Profile.
The most recent heavy volume area got formed yesterday. There was a rotation in the Asian session, and in the European session. In this rotation, heavy volumes got traded.
After this rotation, there was an aggressive buying activity that drove the price upwards again (I call this the Volume Accumulation Setup)
This is another sign of strong buyers dominating the market here.
Because of this new buying activity, I believe that those heavy volumes which got traded yesterday were mostly buyers adding to their long positions.
When the price makes it back (a pullback) into this area again, it is likely that those strong buyers will want to defend their long positions. They will become active again and they will do their best to push the price upwards from there again.
This is why I think this heavy volume area will work as strong support. The place where most of the volumes got traded (POC) is at 0.6672. This is where the reaction is most likely to happen.
AUD/CHF, 30 Minute time frame:

Weekly Volume Profile analysis
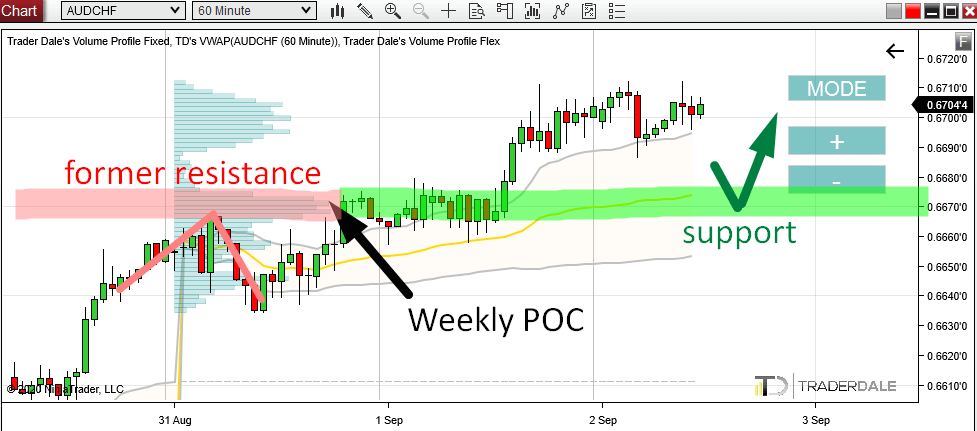
Let’s now have a look at how this whole situation looks from the higher perspective. For this I use Weekly Volume Profile and 60 Minute time frame.
Currently, the support I showed you is at Weekly Point Of Control. This means the heaviest volumes throughout this week (so far) were traded there. This makes the support level even more significant. The reason is that traders who trade bigger time frames also see this support and they are likely to trade it.
Price Action analysis
There is one more thing to all this. That is a Price Action setup which says that a breached Resistance becomes a Support.
On Monday, this area got rejected – the price bounced off it strongly. This was a sign that it was a strong Resistance. Yesterday, the Resistance got breached and because of that it became a Support.
This is an old Price Action setup I like to look for, and use it in combination with other trading signals.
AUD/CHF, 60 Minute chart:
BONUS – VWAP setup
There is one more thing I would like to point out in this AUD/CHF chart.
It is not related to the support I talked about before.
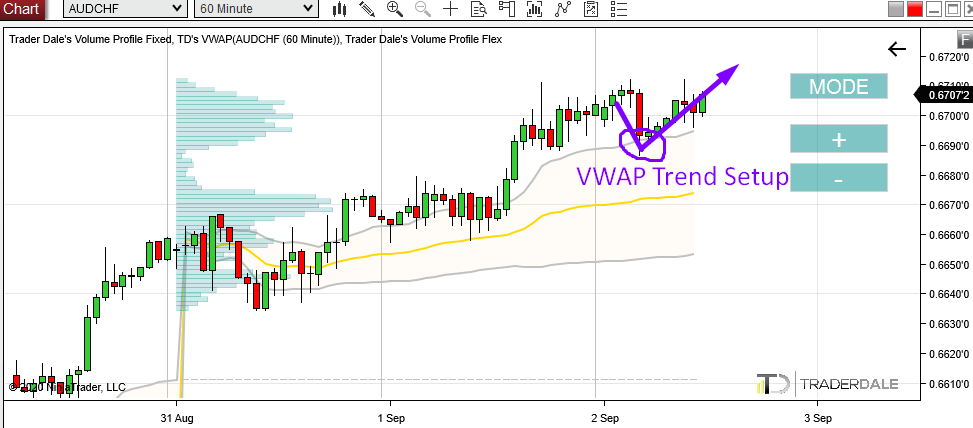
I wanted to show you a VWAP Trend Setup which played out nicely earlier today.
I like to trade this setup with Weekly VWAP as it gives stronger signals than Daily VWAP.
The first thing with this setup is that you wait until the price is above the 1st VWAP Deviation (that’s the grey line).
This tells you that the market is trending.
Then you wait until the price makes a pullback and hits the 1st Deviation from above. When it does, you enter a long trade.
Check it out in the picture below:
You can learn more about trading with VWAP in my Trading Course. You can access it by clicking the banner below:
Do you want ME to help YOU with your trading?
Join one of my Volume Profile Educational courses and get my private trading levels, 15 hours of video content, my custom made Volume Profile indicators, and more!
I hope you guys liked today’s analysis. Let me know your thoughts in the comments below!
Happy trading!
-Dale
- Get link
- X
- Other Apps
- Get link
- X
- Other Apps
Comments
Post a Comment