Today, I will do an intraday analysis of CHF/JPY. It will be a bit different this time because I will also use Order Flow.
Let’s first talk about what the Price Action and Volume Profile show.
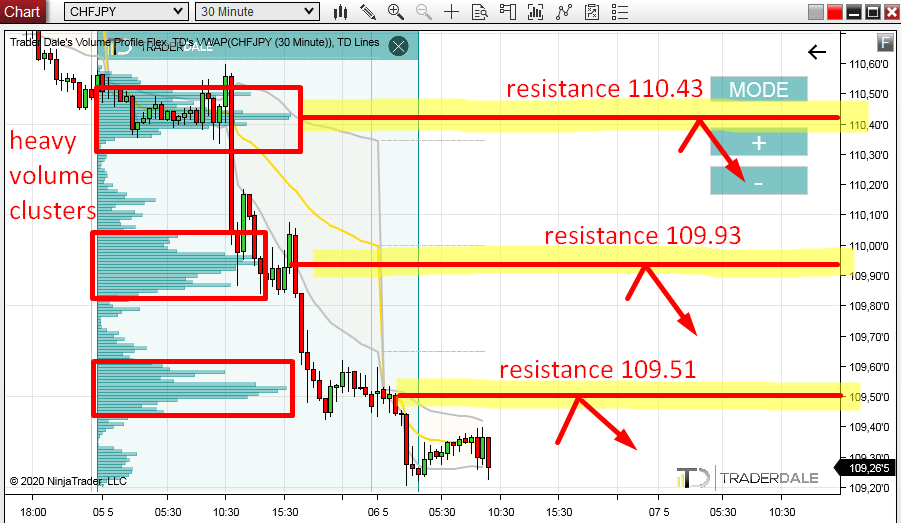
There has been a strong downtrend since the beginning of this week. There haven’t been any major pullbacks and the price has been heading downwards steadily.
The reason CHF/JPY caught my eye today was because there are THREE Volume Clusters! Three very nicely visible and easy to identify heavy volume areas.
I believe that the volumes we see in those three areas were aggressive sellers, who were adding to their selling positions.
After each volume accumulation, those sellers pushed the price aggressively downwards – to make money on those positions they have entered in the Volume Cluster areas.
Those Volume Clusters now represent significant resistance zones. If there is no change in the market sentiment those zones should hold and reverse the price (when there is a pullback).
You can see all that in the screenshot below. It shows 30 Minute chart of CHF/JPY along with those three resistances:
There has been a strong downtrend since the beginning of this week. There haven’t been any major pullbacks and the price has been heading downwards steadily.
Volume Profile analysis
When there is a trend like this I like to use my Volume Profile to look in that trend area. What I look for are significant Volume Clusters (areas where heavy volumes were traded).The reason CHF/JPY caught my eye today was because there are THREE Volume Clusters! Three very nicely visible and easy to identify heavy volume areas.
I believe that the volumes we see in those three areas were aggressive sellers, who were adding to their selling positions.
After each volume accumulation, those sellers pushed the price aggressively downwards – to make money on those positions they have entered in the Volume Cluster areas.
Those Volume Clusters now represent significant resistance zones. If there is no change in the market sentiment those zones should hold and reverse the price (when there is a pullback).
Logic behind Volume Clusters
The logic behind this is that the sellers who have entered their short positions in those Volume Clusters will want to defend their shorts. And if there is a pullback, then those guys are most likely to start selling and pushing the price downwards again. That’s why I think those three areas will work as resistances.You can see all that in the screenshot below. It shows 30 Minute chart of CHF/JPY along with those three resistances:

Order Flow
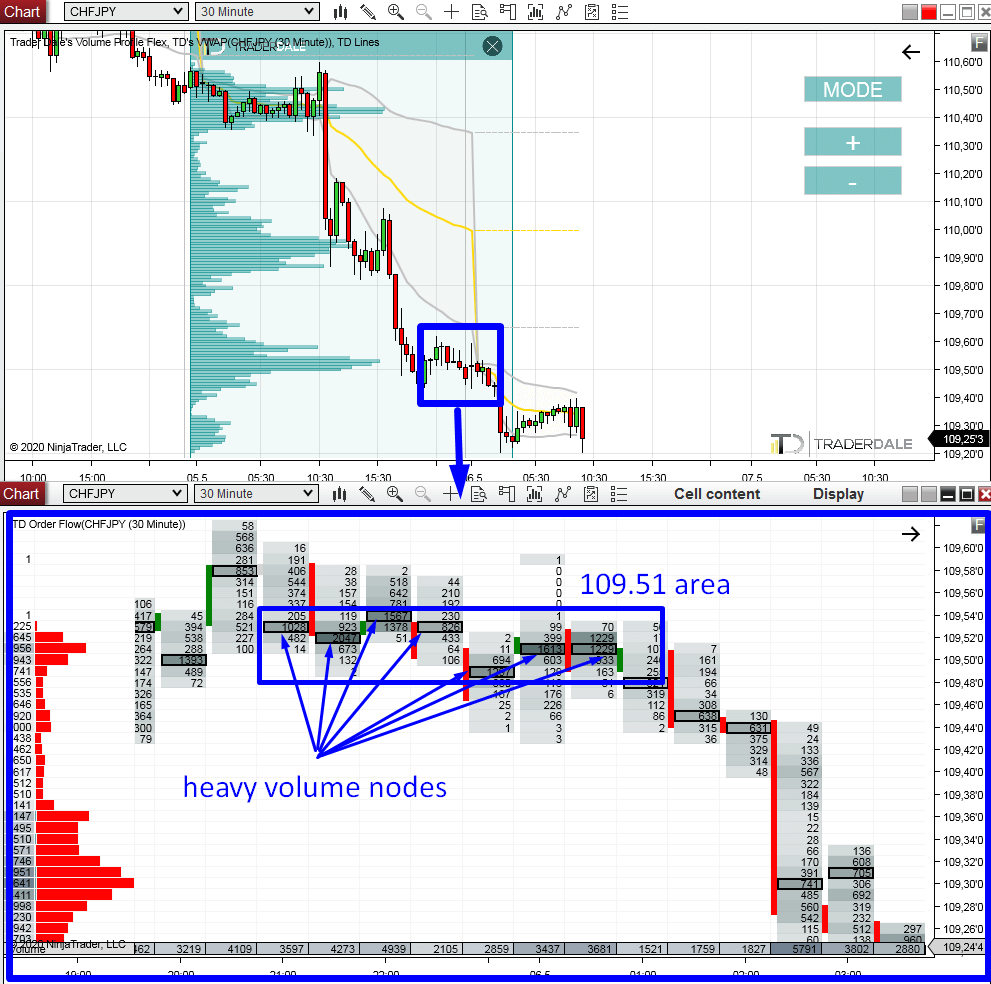
The Order Flow software is usually used with Futures. However, my software has some special features which allows you to use it on Forex too! The functions are limited because Forex is decentralized but still it is pretty helpful!I used the Order Flow to look into detail how the 109.51 resistance area looks like – how exactly the volumes were distributed there.
Heavy volume nodes (HVN)
The most important thing to notice is how the heavy volume nodes were distributed (HVN = those numbers in black rectangles showing where the heaviest volumes were traded in the given footprint).What I want to see is heavy volume nodes created very close to each other – in one price level area. In the picture below, you can see that many of them were created around the 109.51 area.
This gives me another confirmation that the sellers were interested especially in this area. It also helps me identify the best place for a short trade.
In this case, it would be exactly 109.51 because this is where two heavy volume nodes were next to each other. To me this is the most important level which I was able to pin-point with Order Flow.
This is an effective way how you can use Order Flow on Forex to look into detail how support and resistance areas were formed.
If you see heavy volume nodes very close to one price level, then this makes the support/resistance stronger. It confirms it. It also makes your trade entry more precise (you want to enter your trade at the price level where heavy volume nodes were created).
If you see heavy volume nodes very close to one price level, then this makes the support/resistance stronger. It confirms it. It also makes your trade entry more precise (you want to enter your trade at the price level where heavy volume nodes were created).
I hope you guys liked today’s analysis! Let me know what you think in the comments below!
Stay safe and happy trading!
-Dale
Stay safe and happy trading!
-Dale
- Get link
- X
- Other Apps
- Get link
- X
- Other Apps
Hey, thanks for the information. your posts are informative and useful. I am regularly following your posts.
ReplyDeleteCatvision Limited
Hi, I’ve been a lurker around your blog for a few months. I love this article and your entire site! Looking forward to reading more!
ReplyDeleteforex trading tips