**You can learn more about my trading setups in my Volume Profile Webinar
SWING TRADES
All presented swing trade charts are Daily charts (Daily candles).CAD/JPY long from 82.80 area
There is a pretty strong rejection of lower prices on the CAD/JPY. If you look at the price chart you can see that there were a few days of rotation at the low of the rejection. In this rotation, pretty heavy volumes got accumulated. After this accumulation, the price shot aggressively upwards. I think this is a clear sign that the accumulated volumes within the rejection were mostly volumes of strong buyers. When the price gets back to this area, those buyers will most likely defend their long positions and they will push the price upwards again.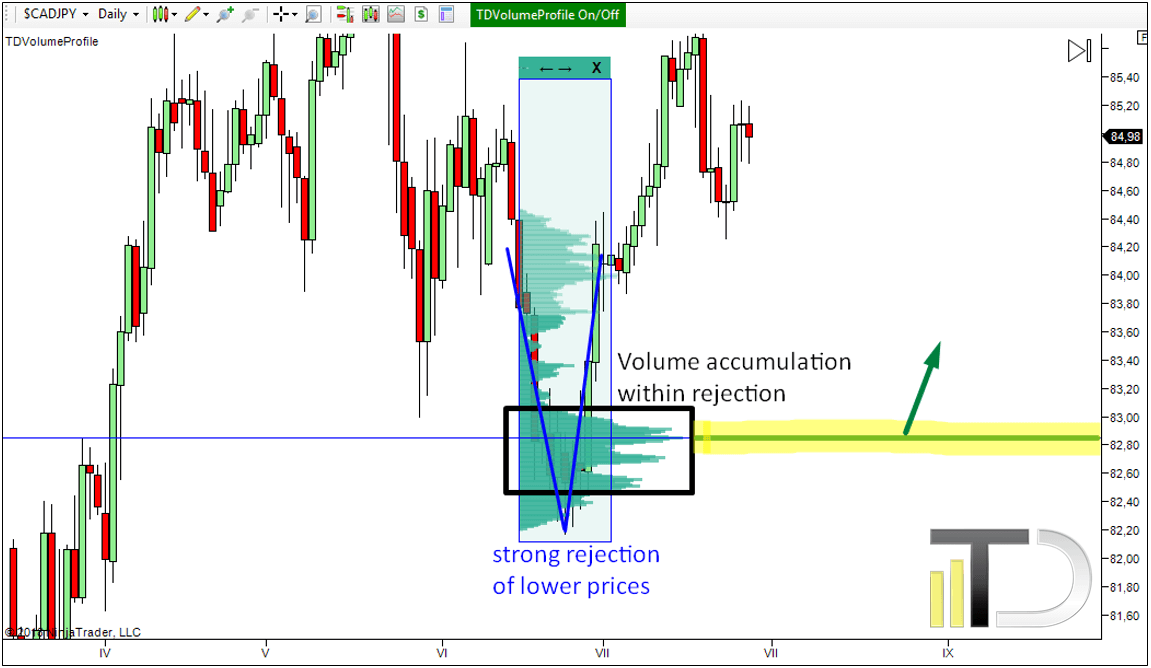
CL (Crude Oil Futures) long from 64.00 – 65.00 area
There is a nice case of Volume accumulation setup on the Crude Oil. In the picture, I marked a sideways price action area in which pretty heavy volumes got accumulated. After this accumulation, the price shot upwards. This indicates that the accumulated volumes were volumes of strong buyers. When the price makes it back to this area, I think that those buyers will be defending their long positions and they will try and push the price upwards again.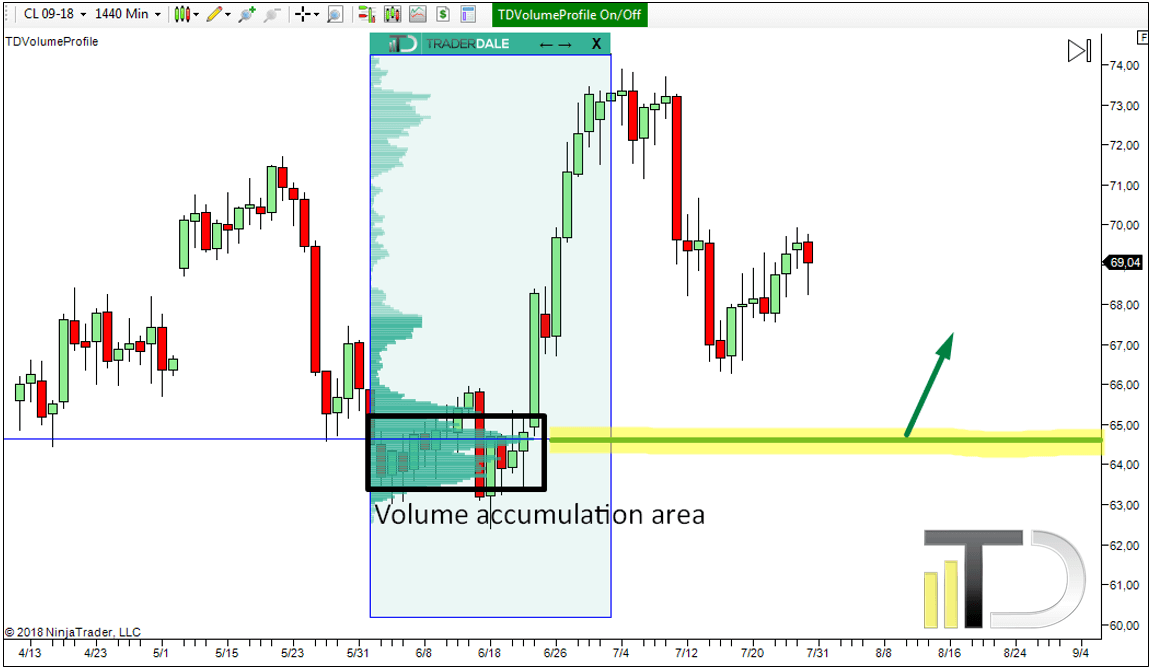
INTRADAY TRADES
All presented intraday charts use 30-minute timeframe (30-minute candles).AUD/CAD long from 0.9635 – 0.9640 area
There was a strong downtrend on the AUD/CAD recently. Now it seems that strong buyers took over. I think so because of the aggressive buying activity that took place on Friday. This doesn’t seem like an ordinary correction. The long bullish candles that shot upwards without any pullback are a sign of strong and aggressive buyers. Those buyers must have accumulated their long positions somewhere. If you look at the Volume Profile you can exactly see where – the rotation area around 0.9635 – 0.9640. When the price goes back to this area I think that the buyers will be defending their positions and that they will push the price upwards from this area again.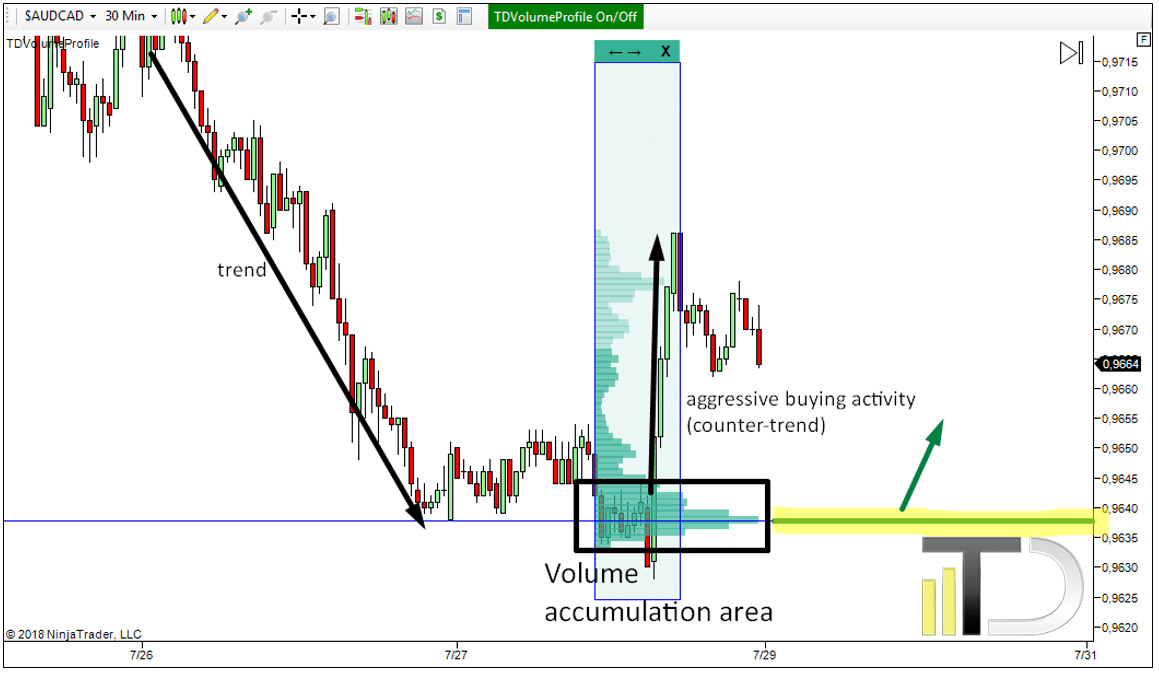
USD/CHF short from 0.9965 – 0.9970 area
There was a strong rejection of higher prices on the USD/CHF recently. Strong rejection like this tells us that strong and aggressive sellers took over and that they were more aggressive than the buyers. If you look at the rejection, you can see that the heaviest volumes were made around 0.9965 – 0.9970. This is the place where the sellers took over and where they placed massive amounts of volumes in the market in order to reverse the price. When the price makes it back to this level, those aggressive sellers will most likely defend their positions again and they will initiate a strong selling activity (again).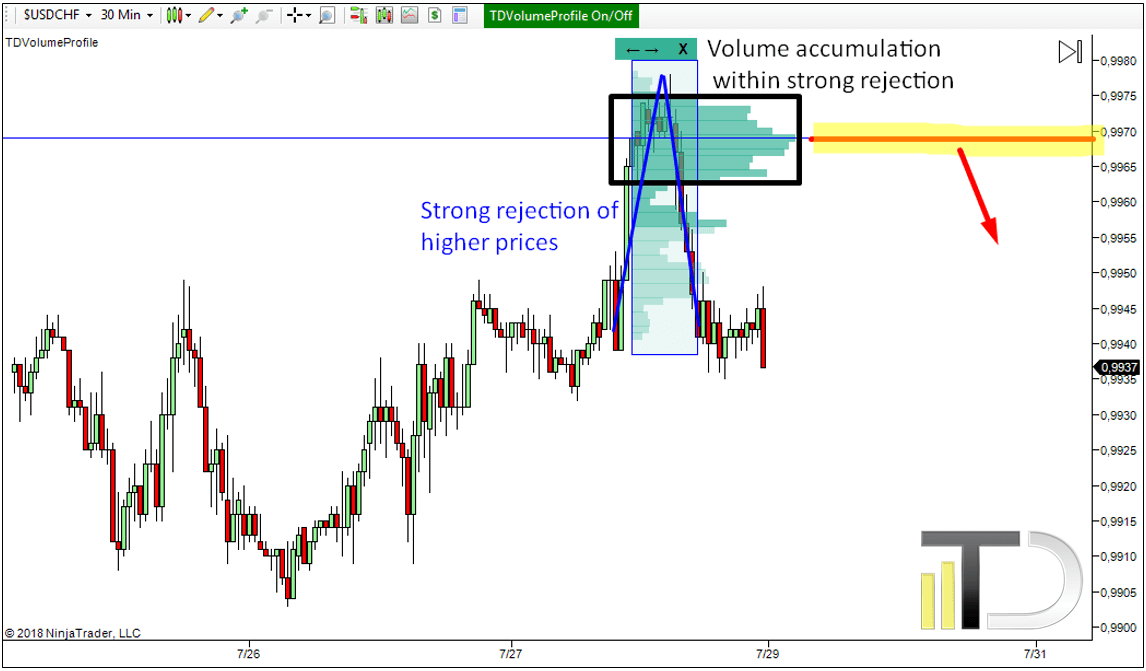
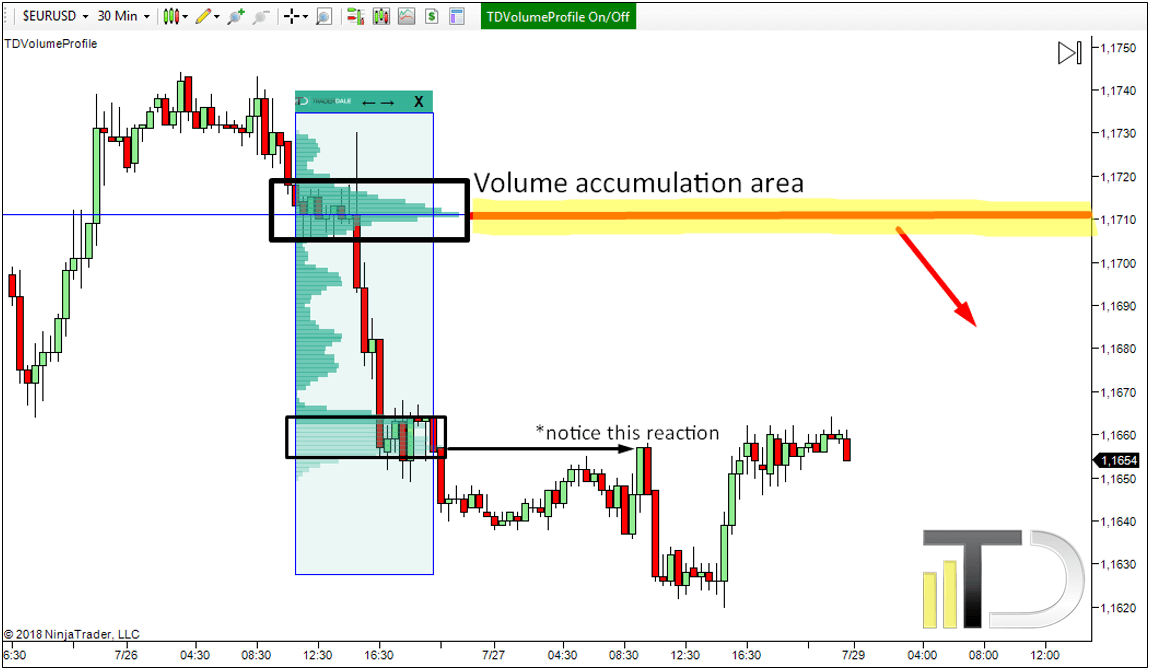
EUR/USD short from 1.1710 area
The last trading idea I am going to talk about is on the EUR/USD. There is a nice case of Volume accumulation setup. What I especially like about this particular case is the volume accumulation followed by sharp rejection of higher prices, which got immediately followed by rapid sell-off. This basically tells us that there were strong and aggressive sellers accumulating their selling positions in sideways price action. Then there was a false breakout to the upside and then strong sellers took over aggressively and pushed the price lower into a downtrend. For me, the most important place is the place where most of the volumes got accumulated before the sell-off started. This is the area around 1.1710. When the price makes it back to this area, I think that strong sellers will initiate strong selling activity (again) to protect their short positions. This should drive the price lower again.Another thing worth mentioning is the nice reaction to the volume cluster which I also marked in the picture. I call this setup the “Trend setup”. You can learn more about it here: Dale’s setup n.2: the Trend setup
I hope you guys found my ideas inspiring and useful.
Happy trading
-Dale
P.S. Want my intraday trading analysis every day as well as swing trade analysis for 15 forex pairs every month? Then check out my Advanced Volume Profile Training Course and Members Forum for more information – Click Here to Start Learning Now
Comments
Post a Comment