**You can learn more about my trading setups in my new book: VOLUME PROFILE: The insider’s guide to trading
SWING TRADES
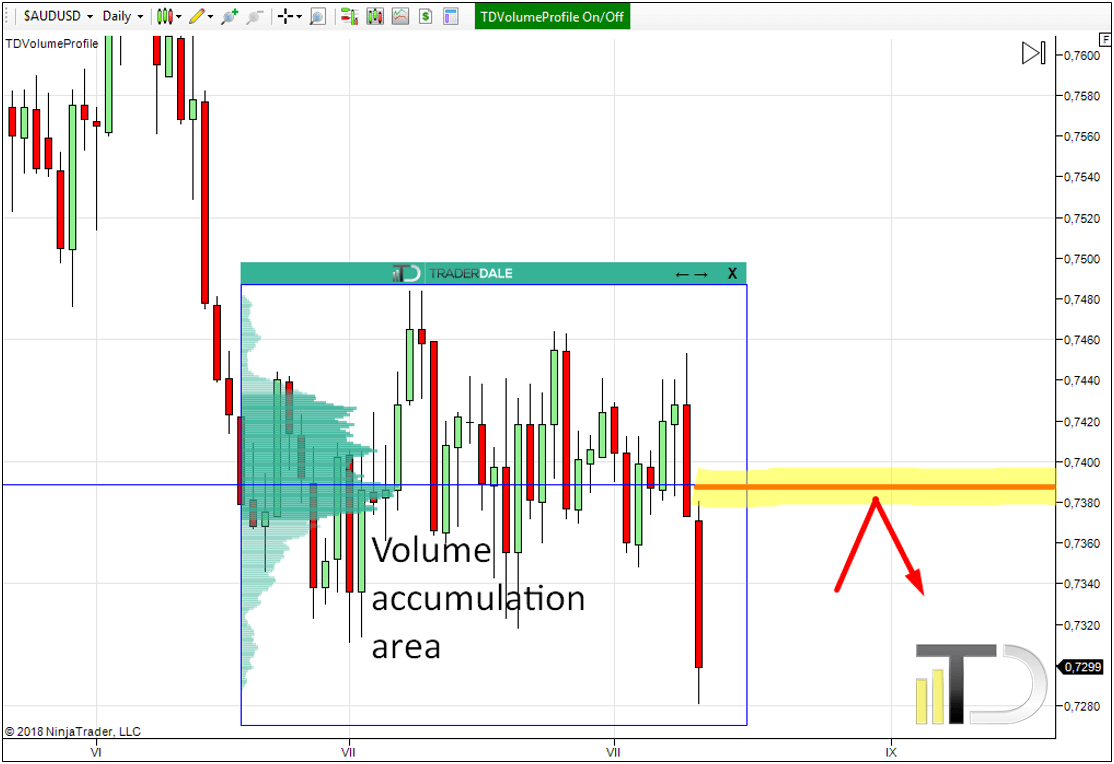
All presented swing trade charts are Daily charts (Daily candles) if not stated otherwise.AUD/USD short from 0.7388
There was a very long rotation on the AUD/USD. Now it seems that the price finally broke out of the channel into a sell-off. If this selling wasn’t just a false break-out then it indicates that there was a lot of short positions accumulated within the rotation area. Most of them at 0.7388 – this is the POC of the rotation.When the price makes a pullback to this area I expect that the sellers will defend their selling positions aggressively and that they will push the price lower again.
AUD/NZD long from 1.0896
This is a very similar scenario as on the previous trade (on AUD/USD). In this case, I think that a lot of long positions got accumulated in a rotation area in July. Then there was a strong buying activity which pushed the price into an uptrend. When the price makes it back to the POC of this rotation (1.0896) I think that the buyers who were accumulating their long positions there will be defending their positions and they will push the price upwards again.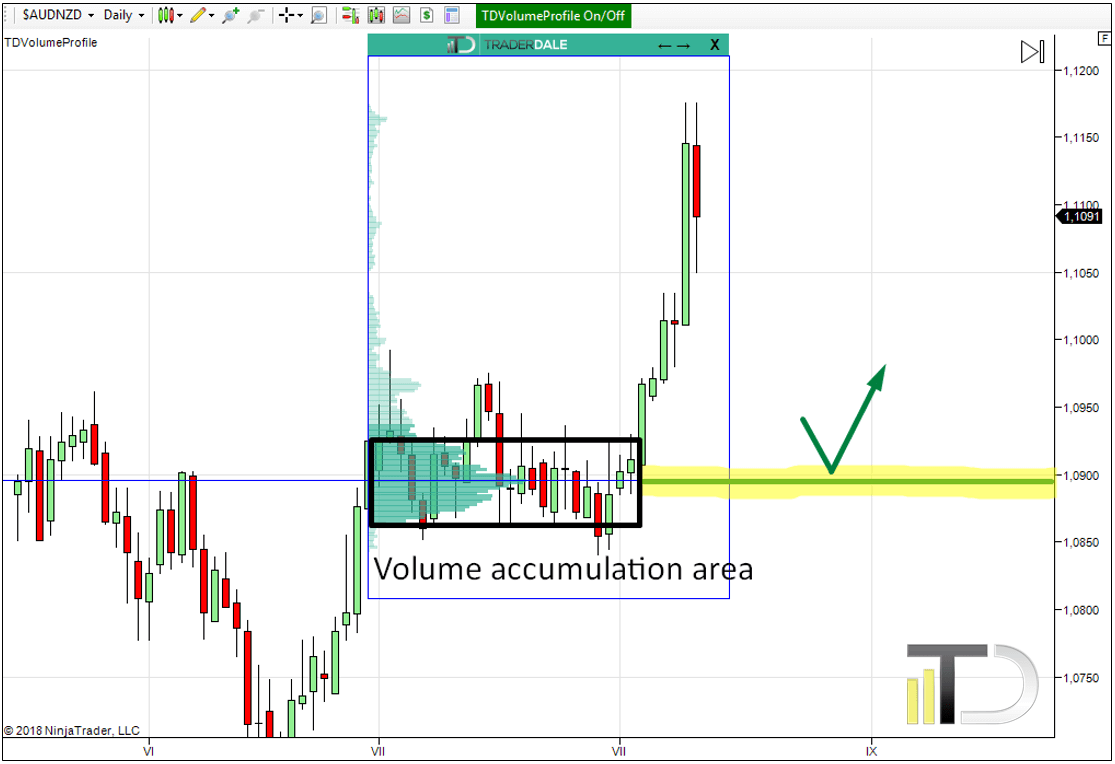
INTRADAY TRADES
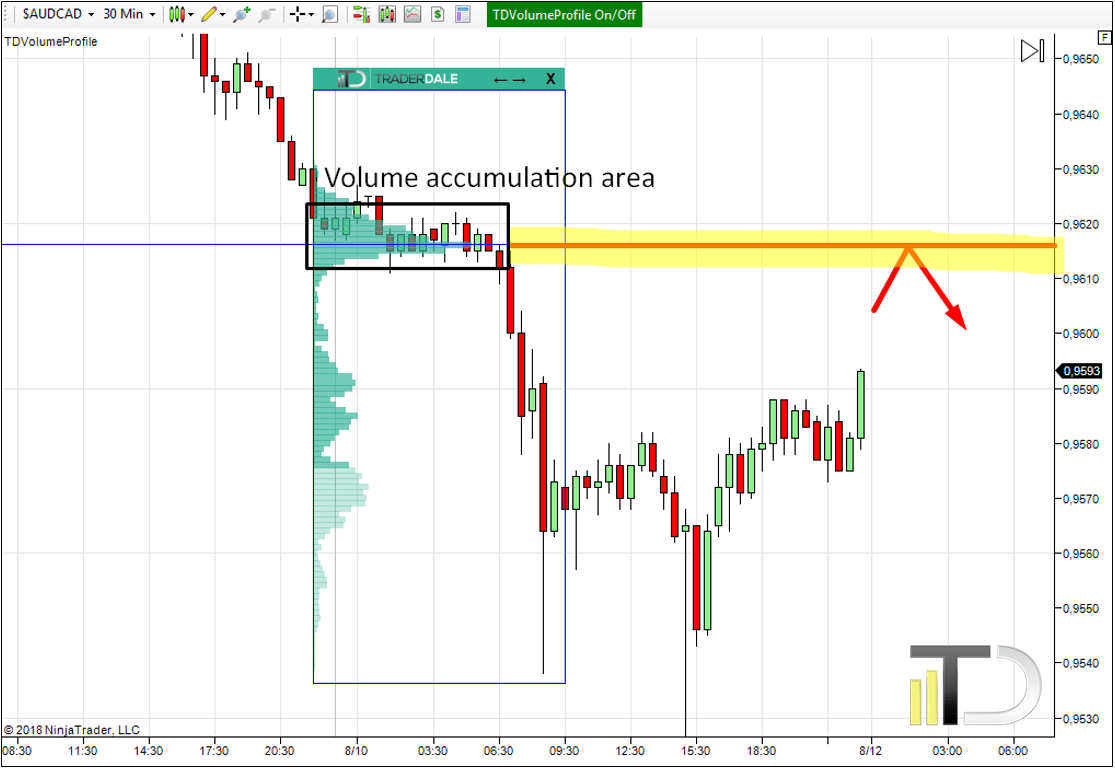
All presented intraday charts use 30-minute timeframe (30-minute candles).AUD/CAD short from 0.9616
This short trade idea is based on the Volume accumulation setup. I think that a lot of short positions got accumulated in the heavy volume area around 0.9616. I think this because the price shot aggressively downwards from this place. When the price makes it back there I expect that sellers will be defending their selling positions and that they will push the price downwards again.There is also one more trading setup present there. It is called the “Open-drive” and I write about it in my new book. You can get it here: Dale’s new book
EUR/GBP short from 0.9013
This trade idea is based on heavy volumes that got accumulated in a rotation around 0.9013 on the EUR/GBP. Strong selling activity started after this rotation so I think that positions in the rotation were mostly selling positions. When the price makes it back to this level I think that those sellers who were accumulating their positions in the rotation area will defend those positions and they will push the price aggressively downwards again.
CL (crude oil futures) short from 69.21
This short trade idea is very similar to the previous short level on the EUR/GBP. It is also based on the Volume accumulation setup. This time the selling activity was pretty significant and the downtrend really strong. I will be waiting for the price to come back to 69.20 and I’ll go short from there. I think that strong sellers who were accumulating their positions in this area will be defending those positions again – which will most likely result in another selling activity from there.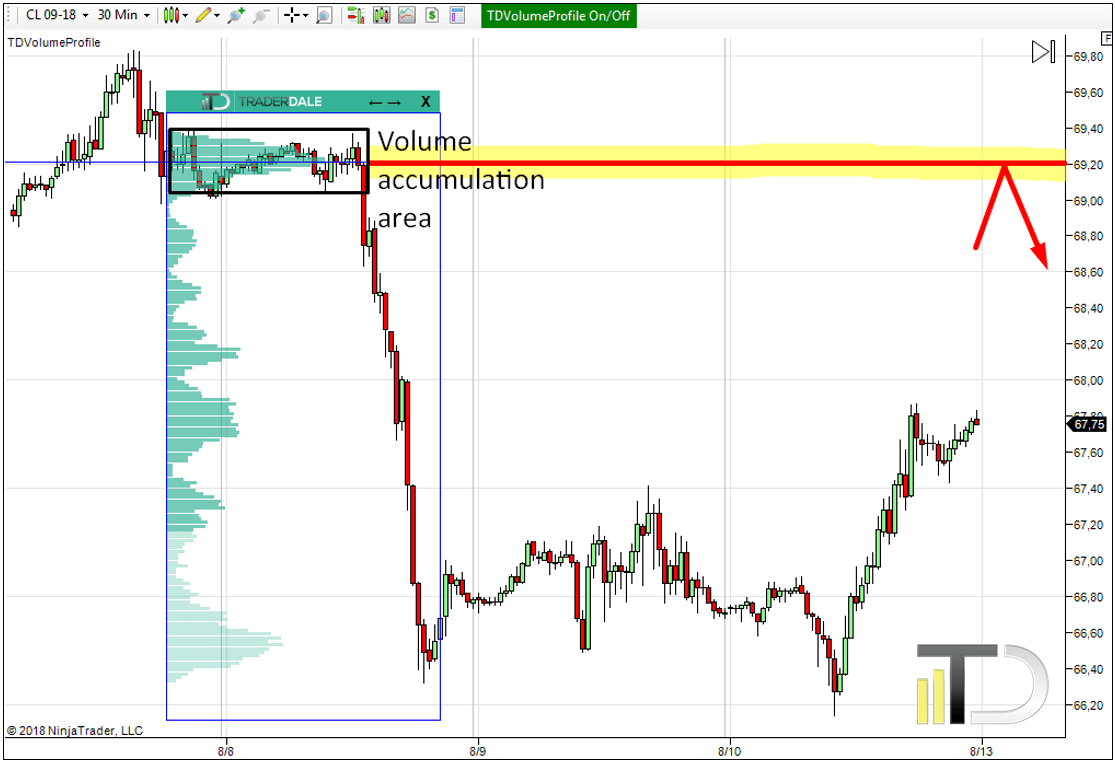
I hope you guys found my ideas inspiring and useful.
Happy trading
-Dale
PS. I have just released a new book: VOLUME PROFILE: The insider’s guide to trading. I put a ton of work into it and I am sure it will prove extremely helpful to you. Go and get your copy HERE. I guarantee you that this will be the best $4.99 you ever spent.
PPS. I am using my custom made Flexible Volume Profile for all my analysis. You can get it here: TD’s Flexible Volume Profile
PPPS. Want my intraday trading analysis every day as well as swing trade analysis for 15 forex pairs every month? Then check out my Advanced Volume Profile Training Course and Members Forum for more information – Click Here to Start Learning Now
Comments
Post a Comment