
CAD/JPY: Volume Profile and Price Action Analysis


Trader Dale - Free Book

Hello guys,

yesterday, I posted here a video with a couple of trading ideas for this week. If you missed it, then you can watch it here:

Volume Profile Trading Ideas – 11th October 2021

Today, I would like to show you one more. It is a day trading Support that has formed on CAD/JPY.

The first thing to catch my eye when I opened the CAD/JPY chart was the strong uptrend. Trends are usually very nice opportunities to trade.

The way I like to trade them is to wait until a trend is established – meaning that it is easily visible on a 30 Minute chart and it’s strong. Like in this case.

Volume Profile Analysis

Then I use my Flexible Volume Profile indicator to look into the trend area (only into the trend area). I am interested in how volumes were distributed throughout the trend. What I look for are heavy volume zones. I call them the “Volume Clusters“.

Such Volume Clusters represent strong Support/Resistances.

In this case, there is an uptrend. A Volume Cluster created within an uptrend represents a Support.

CAD/JPY, 30 Minute chart:

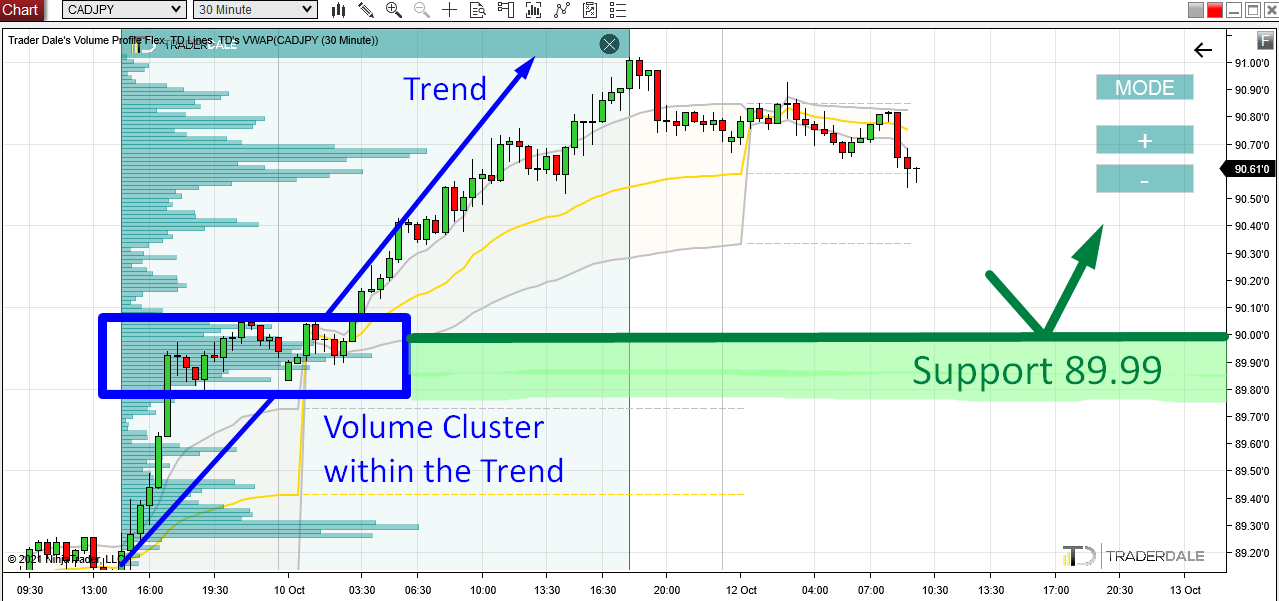
This Volume Cluster tells us that strong Buyers who were pushing the price upwards were adding to their Longs in this heavy volume area.

Those heavy volumes – that’s them. The Big institutional traders.

Pullback to 89.99

When the price makes a pullback into this area again (starting around 89.99) then those strong Buyers should became active here again. They should try and push the price upwards from this zone once more.

The reason is that this zone is clearly important for them. They placed a lot of their Longs there.

They will want to add some more here – in this high-liquidity zone and push the price upwards some more.

That’s what makes it a strong Support.

This Volume Profile setup is called the “Trend Setup” and you can learn all there is about it in my Volume Profile Training Course.

Do you want ME to help YOU with your trading?

Join one of my Volume Profile Educational courses and get my private trading levels, 15 hours of video content, my custom made Volume Profile indicators, and more!

I hope you guys liked my analysis! Let me know what you think in the comments below!

Happy trading,

-Dale

Comments

Popular posts from this blog

How to Track The Institutions With Volume Profile – Weekly Trading Ideas 6.4.2020

*Disclaimer: Presented opinions, trades and trading ideas on the markets and charts is not advice nor a trading recommendation. It is general information and it is for educational purposes only. **You can learn more about my trading setups in my new book: VOLUME PROFILE: The insider’s guide to trading If you would like to learn to trade with Volume Profile and to trade with me every day, then join my Trading Course!

Bitcoin is Dropping Hard! Here’s Where Smart Money Will Buy Again

Video Transcript: Hello everyone, it’s Dale here. In today’s video, I’d like to talk about Bitcoin. The reason is that Bitcoin has been dropping like crazy, and a lot of traders are wondering where Bitcoin will go and what to expect. If I look at the chart and use Volume Profile, I would say that it’s pretty straightforward because Volume Profile very clearly shows the strongest support and resistance levels. So, let’s take a look at the chart, and let me show you. What you see before you is the daily chart of Bitcoin. This is the big picture, and as you can see, from the all-time high here, Bitcoin experienced quite a significant sell-off and is currently dropping. Right now, I don’t really see any strong support that would stand in the way of this strong sell-off. Let me use Volume Profile and show you what could actually stop the sell-off of Bitcoin. All right, so what I’m going to do is apply Volume Profile over this whole area to see the volume distribution. As you can see, there ...

Recent Trade Breakdown: Combining Price Action & Volume Profile for Smarter Trades

Video Transcript: Hello everyone, it’s Dale here. In this new video series, I want to break down my recent trades. The goal of this series is to show you how I use my Volume Profile trading setups every day in real market conditions, so you can learn from both my wins and my mistakes. If you find this helpful, don’t forget to hit the like and subscribe buttons. Let’s dive in. What you see before you is a screenshot from my session yesterday. It’s taken from the live trading room we held in the  Funded Trader Academy . During that session, a new setup was forming on the  AUD/USD . This is the  AUD/USD  on a 30-minute timeframe, and the new setup was forming right here. There was a resistance level forming around  0.6364 . The reason behind this setup was based on a couple of factors. The main reason was a Volume Profile setup. If you look here at what I’ve highlighted, this area represents a heavy volume zone, which the resistance level was based on. You can see ...