
USD/JPY: Volume Profile and Price Action Analysis


Hello guys,

today I would like to have a closer look at the USD/JPY.

For the last couple of days this pair has been in a strong uptrend.

I am always interested in trading trending pairs and I always want to jump in the trend and participate in it.

However, I don’t just jump into the trend without any thought. I always wait for a pullback. A pullback to heavy volume area.

Why heavy volume area? Because those represent strong Support and Resistance zones.

In this case, strong institutional Buyers are pushing the USD/JPY upwards aggressively.

Volume Profile Analysis

What my Volume Profile indicator is telling me is that those Buyers were adding to their Longs around 111.01.

As you can see in the picture below, this is the area where the Volume Profile is wide = heavy volumes were traded there.

Because the uptrend continued from here, we can assume, that Buyers were adding to their Longs there (in the heavy volume area starting around 111.01)

USD/JPY; 30 Minute chart:

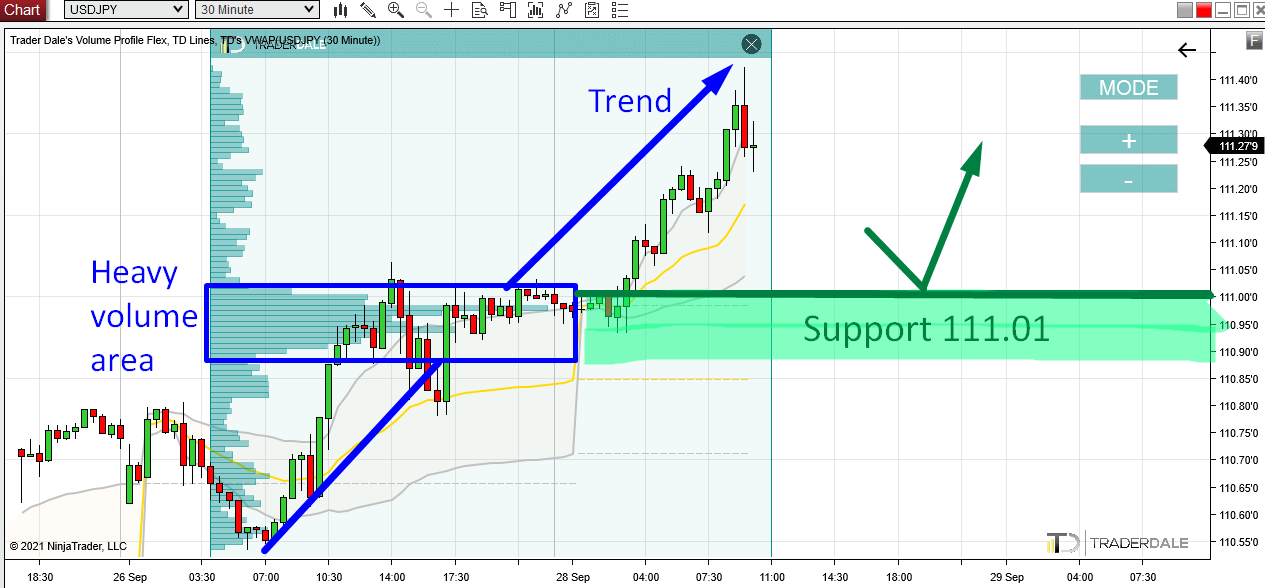
The heavy volume zone starting at 111.01 is an important area now. The reason is that strong institutional Buyers were adding to their Long positions there – they are clearly interested in this zone. They would not want to let the price go past it. Not without a fight.

This is the reason I think, that when there is a pullback to 111.01 those strong Buyers will want to defend this zone and this should make it a strong day trading Support.

The setup I used here is called the “Volume Profile: Trend Setup“.

I hope you guys liked my analysis! Let me know what you think in the comments below!

Happy trading,

-Dale

Comments

Popular posts from this blog

How to Track The Institutions With Volume Profile – Weekly Trading Ideas 6.4.2020

*Disclaimer: Presented opinions, trades and trading ideas on the markets and charts is not advice nor a trading recommendation. It is general information and it is for educational purposes only. **You can learn more about my trading setups in my new book: VOLUME PROFILE: The insider’s guide to trading If you would like to learn to trade with Volume Profile and to trade with me every day, then join my Trading Course!

Recent Trade Breakdown: Combining Price Action & Volume Profile for Smarter Trades

Video Transcript: Hello everyone, it’s Dale here. In this new video series, I want to break down my recent trades. The goal of this series is to show you how I use my Volume Profile trading setups every day in real market conditions, so you can learn from both my wins and my mistakes. If you find this helpful, don’t forget to hit the like and subscribe buttons. Let’s dive in. What you see before you is a screenshot from my session yesterday. It’s taken from the live trading room we held in the  Funded Trader Academy . During that session, a new setup was forming on the  AUD/USD . This is the  AUD/USD  on a 30-minute timeframe, and the new setup was forming right here. There was a resistance level forming around  0.6364 . The reason behind this setup was based on a couple of factors. The main reason was a Volume Profile setup. If you look here at what I’ve highlighted, this area represents a heavy volume zone, which the resistance level was based on. You can see ...

ORDER FLOW: How to Trade the Absorption Setup (Trade Entry Confirmation)

Video Transcript: Hello everyone, and in this video, I’d like to talk about order flow and one of my favorite confirmation setups in order flow. The confirmation setup is called the absorption, and I’ll show you an example of a trade I made a couple of days ago. I think this is the perfect example of how you can use the absorption setup to confirm your trade entry. So, let’s take a look at it. First, let me start by showing you the level I wanted to trade, and then I’ll show you the absorption setup. You’re looking at the  EUR/USD  30-minute chart, and I had a long level here, marked by this line. This was a long level based on a Volume Profile setup, focusing on those heavy volumes formed within this important rejection. So, this was the long level. What happened was that the price started to go into a sudden sell-off, and there wasn’t really any strong macro news behind this. I wasn’t really sure what was going on, but there was this sudden sell-off, this spike move. Because...