The Order Flow is a software that reads all the trades that are filled
in the market, and then it prints them in a chart so you can read them.
It also shows you if the trade was filled at Bid or on the Ask side.
If you take all that and print it into one chart, then it could become a bit overwhelming and confusing. Nobody will ever be able to read all the numbers jumping in and make head or tails out of them. That would be like reading in the Matrix… It is just too much information to process.
That’s why we need to visually distinguish the important info.
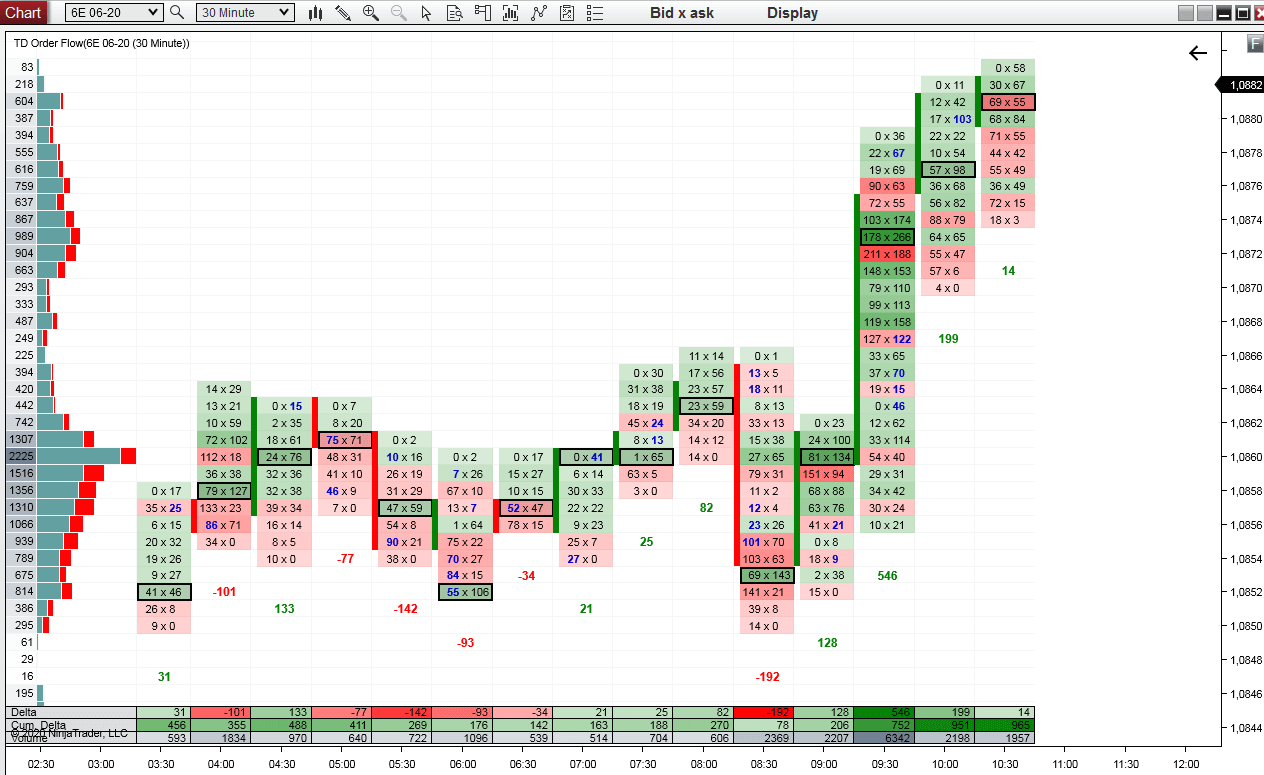
If I simply print all the data coming in into a chart, then it will look like the picture below. What helps is the green/red colors and also the different shades. But still, if you have only a little experience with the Order Flow, then it is hard to know what exactly to look for.
Below is a 30 Minute Order Flow chart of the EUR currency futures (6e 06-20)
If you take all that and print it into one chart, then it could become a bit overwhelming and confusing. Nobody will ever be able to read all the numbers jumping in and make head or tails out of them. That would be like reading in the Matrix… It is just too much information to process.
That’s why we need to visually distinguish the important info.
If I simply print all the data coming in into a chart, then it will look like the picture below. What helps is the green/red colors and also the different shades. But still, if you have only a little experience with the Order Flow, then it is hard to know what exactly to look for.
Below is a 30 Minute Order Flow chart of the EUR currency futures (6e 06-20)

Trades Filter
Is the picture above too complicated? Don’t worry!The new Order Flow video course which I am working on right now will teach you what exactly to look for and you will be able to understand even this!
But there are also ways how to make things way easier! One of those things is a Trades Filter (or as I also like to call it: “The Big guys filter”).
This cool feature is able to filter out all smaller trades (low volume trades) and leave only the biggest ones.
Those are without doubt trades of the BIG guys (financial institutions). Those are the ones you want to follow with the Order Flow!
In the picture below I filtered out all the trades that were smaller than 25 contracts. It left only few big trades and the rest is printed as 0. Now you see where the BIG guys were active and where they entered their big trades!
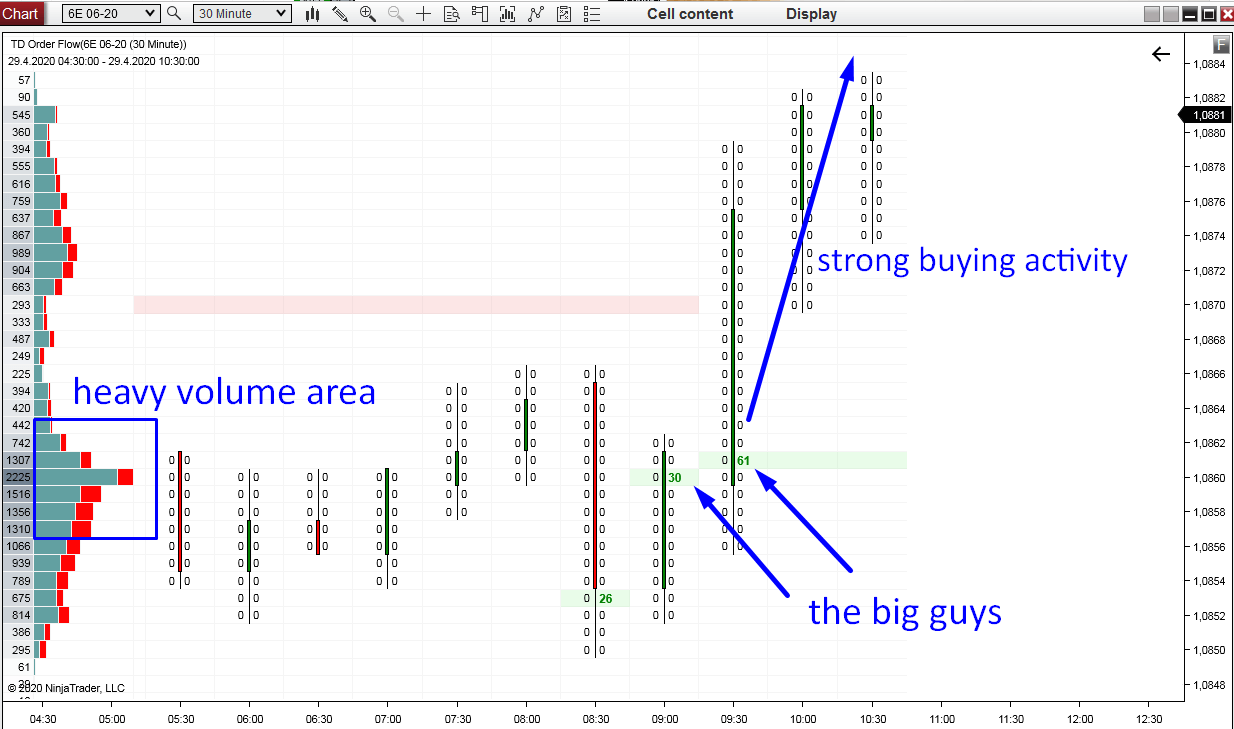
Suddenly the Order Flow chart is super easy to read, right?
Then at the end of the rotation, the BIG guys started to jump in with heavy volumes and they started a strong buying activity.
Those heavy volumes were on the ASK side of the market. It indicates that those were made with MARKET BUY orders (=big guys wanting to start a trend are buying aggressively)
What do you think will happen when the price makes a pullback into this area again? I think that those BIG guys will want to defend their longs which they placed there and they will most likely start pushing the price upwards again! This will make this area a strong support.
This is super simple strategy! Combine it with the Volume Profile and you have a great trading system!
BTW if you are wondering where this support is on EUR/USD (forex), then it is around 1.0850.
Be careful though, there is a significant macro news coming up later today (the US GDP, and later on the FOMC). Don’t place any trades around this!
How to read the Trades Filter
There was a rotation in which heavy volumes were accumulated (you can see this on the Volume Profile on the left).Then at the end of the rotation, the BIG guys started to jump in with heavy volumes and they started a strong buying activity.
Those heavy volumes were on the ASK side of the market. It indicates that those were made with MARKET BUY orders (=big guys wanting to start a trend are buying aggressively)
What do you think will happen when the price makes a pullback into this area again? I think that those BIG guys will want to defend their longs which they placed there and they will most likely start pushing the price upwards again! This will make this area a strong support.
This is super simple strategy! Combine it with the Volume Profile and you have a great trading system!
BTW if you are wondering where this support is on EUR/USD (forex), then it is around 1.0850.
Be careful though, there is a significant macro news coming up later today (the US GDP, and later on the FOMC). Don’t place any trades around this!
Release info
My Order Flow software will be out pretty soon. I hope in 2-3 weeks. It is almost finished now, but I am still working on an Order Flow video course.I want to give you the full service, not just the indicator. I want to make sure that when you have the indicator, you know EXACTLY how to work with it and that you feel confident using it.
My Order Flow will have many very useful features like this one to make it as easy as possible to read.
It will be pretty unique and I cannot wait to release it!
Stay safe and happy trading!
-Dale
-Dale
- Get link
- X
- Other Apps
- Get link
- X
- Other Apps
Hey, thanks for the information. your posts are informative and useful. I am regularly following your posts.
ReplyDeleteClio Infotech Ltd