VWAP DEFINITION:
VWAP stands for Volume Weighted Average Price. It is a trading indicator that shows where the “fair value” of the instrument is. It is calculated using PRICE and VOLUMES.
VWAP stands for Volume Weighted Average Price. It is a trading indicator that shows where the “fair value” of the instrument is. It is calculated using PRICE and VOLUMES.
How does VWAP work?
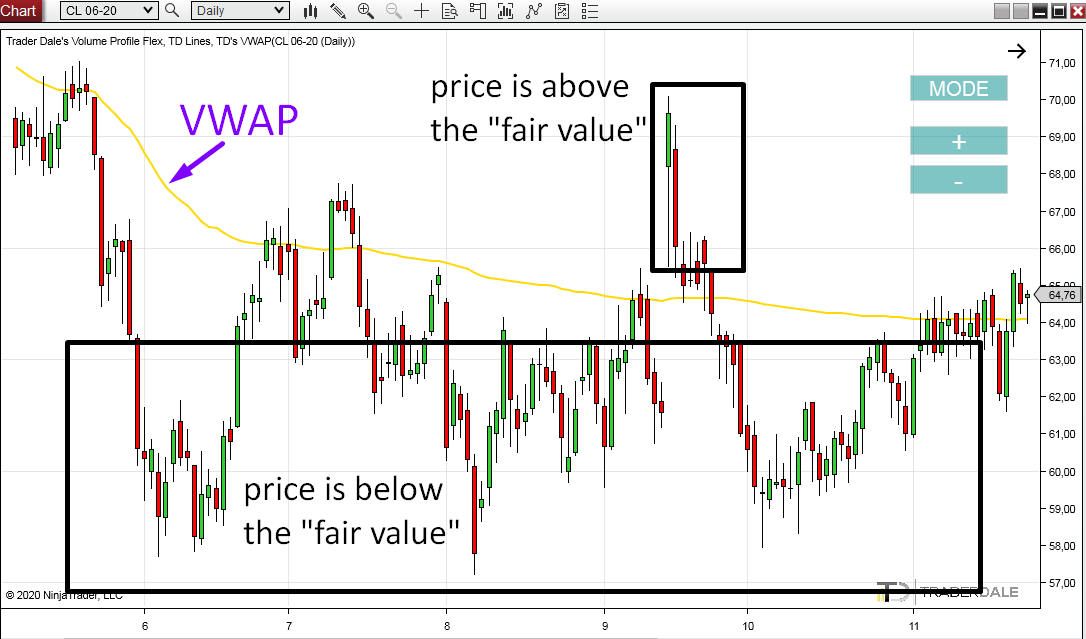
WVAP is a simple line that shows on a price chart. It shows where the “fair value” of the trading instrument is.If the price is above this line, then the instrument is overpriced and its price should drop back to the VWAP line.
If the price is below the line, then it is undervalued and it should move upwards back to the VWAP line.
How is VWAP different to EMA, SMA, and other standard Average indicators?
Standard indicators that show the average price (EMA, SMA, …) are calculated using two variables: PRICE and TIME.VWAP brings VOLUME into the equation. It is calculated using three variables: PRICE, TIME and VOLUMES.
This is really important, because VOLUMES make all the difference!
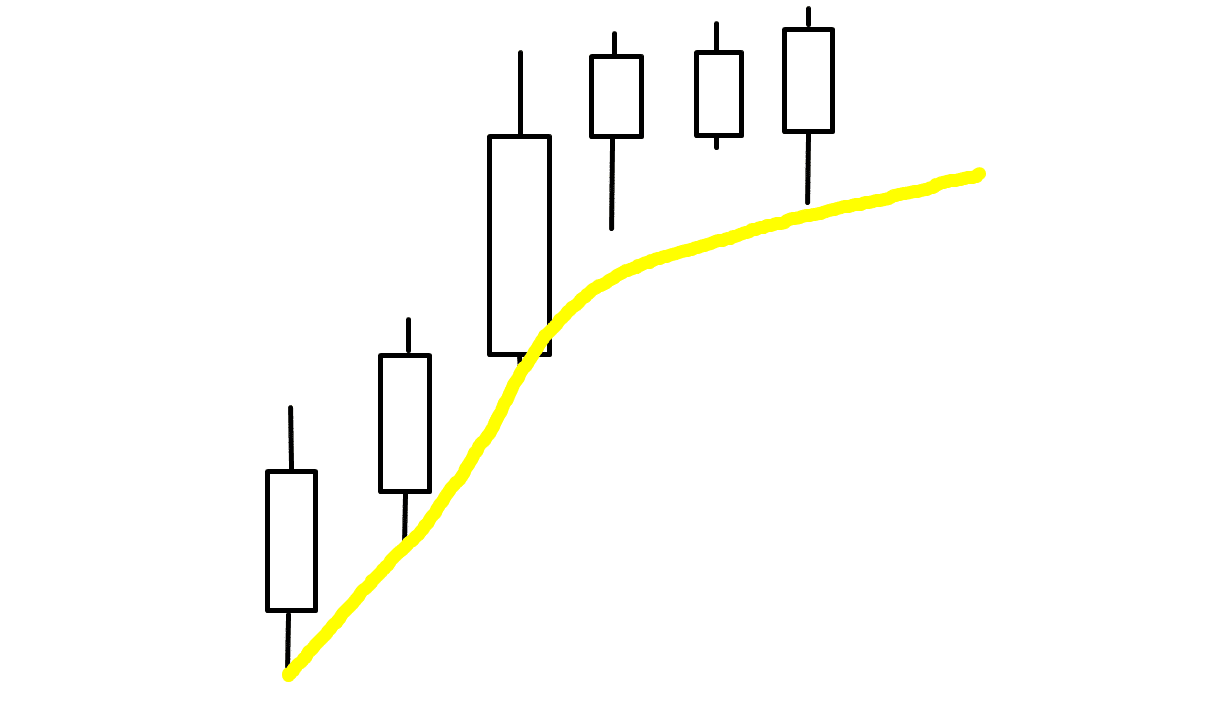
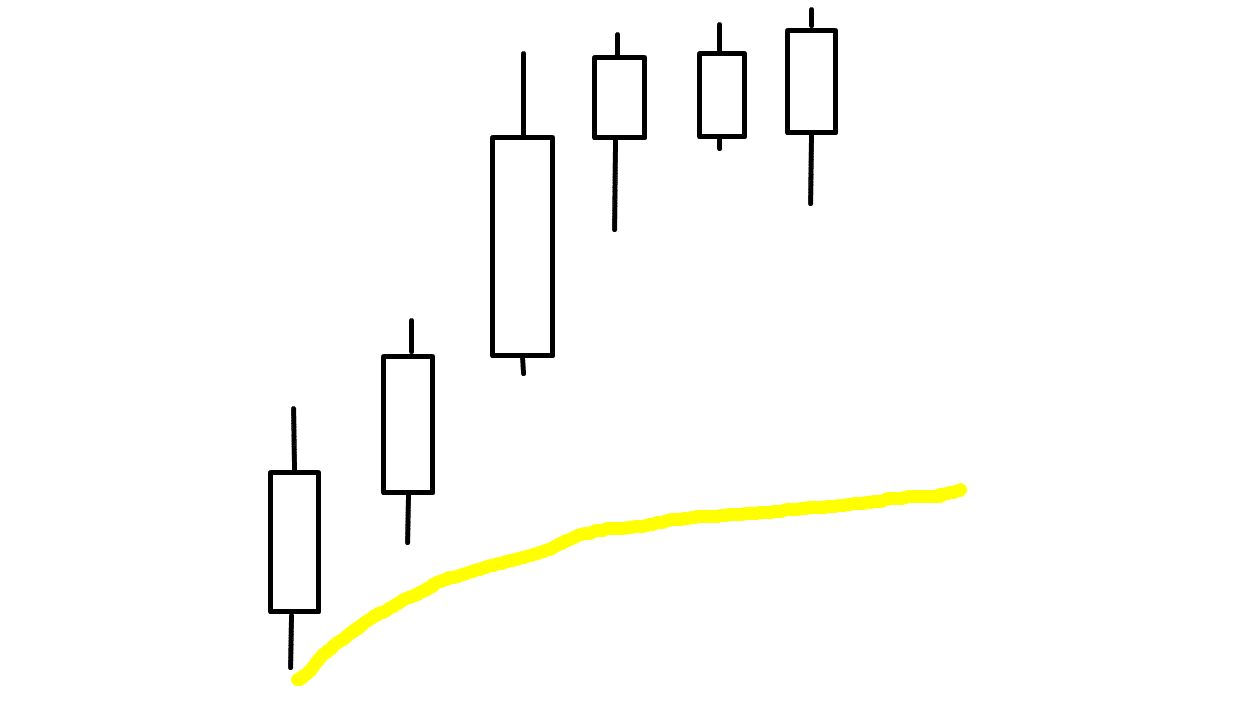
Imagine two scenarios:
1. In the first one, the price moves upwards and many institutions are joining in and adding their longs to the buying rally. In this case, the VWAP line moves upwards.
2. In the second scenario, the price also moves upwards but there are no big volumes behind the move. There are no big guys pushing the price upwards. In this case the VWAP won’t move too much and the “fair value” will stay at the lower price levels.
None of the standard Average indicators is able to reflect this! The reason is simple – they don’t use VOLUMES in their calculation.
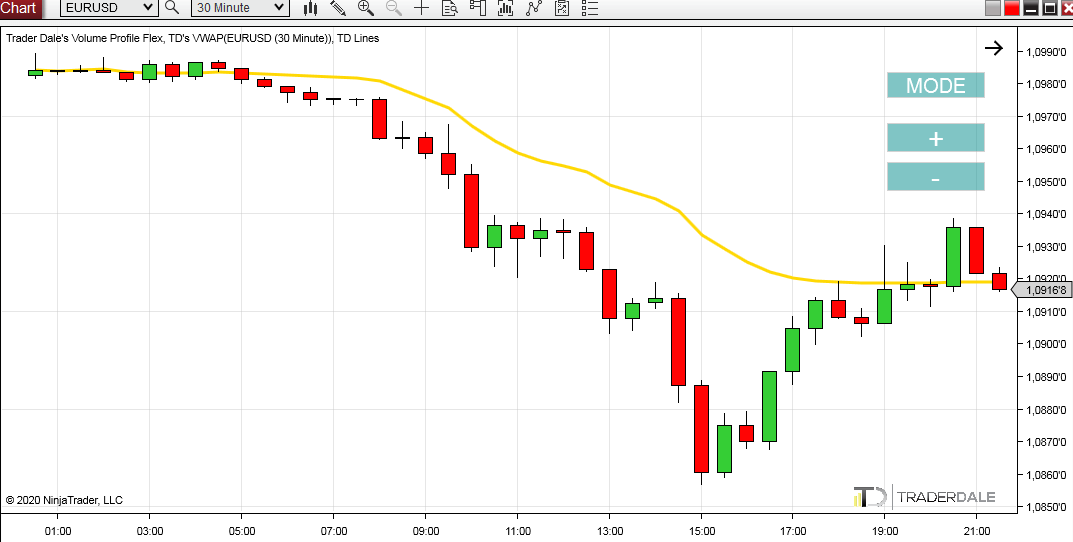
In the picture below, you can see that the price (and volumes) are shifting downwards. VWAP reflects that and the “fair value” moves downwards too.
In the picture below, you can see that the price (and volumes) are shifting downwards. VWAP reflects that and the “fair value” moves downwards too.
How to use VWAP in trading?
There are more ways how to trade using the VWAP. The simplest way comes from the logic, that the VWAP represents a “fair value” and that the price should always return to it.
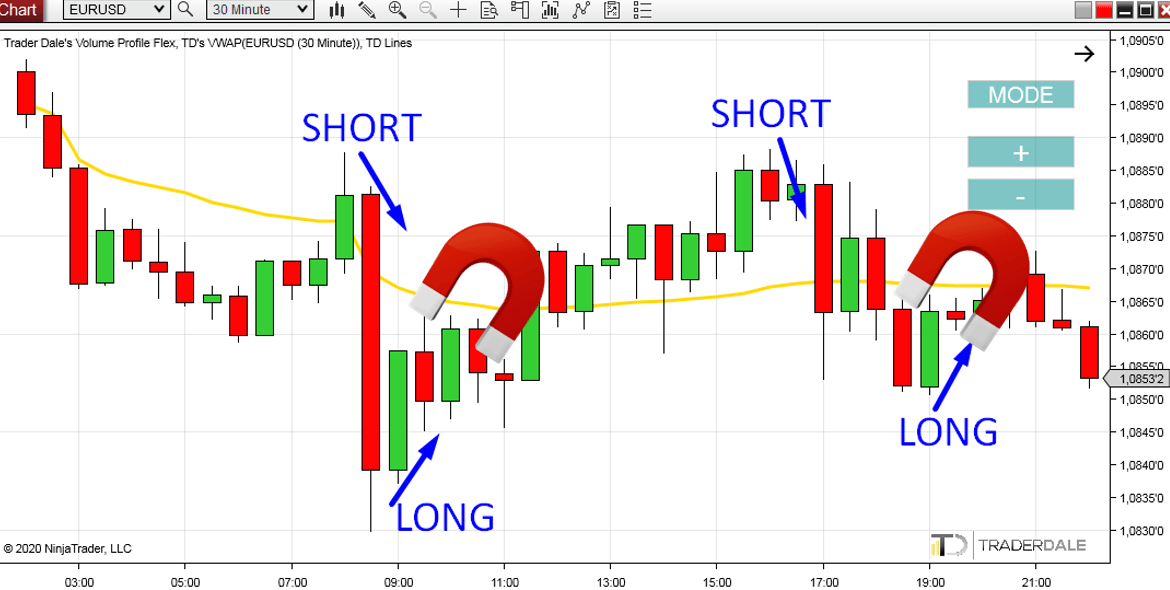
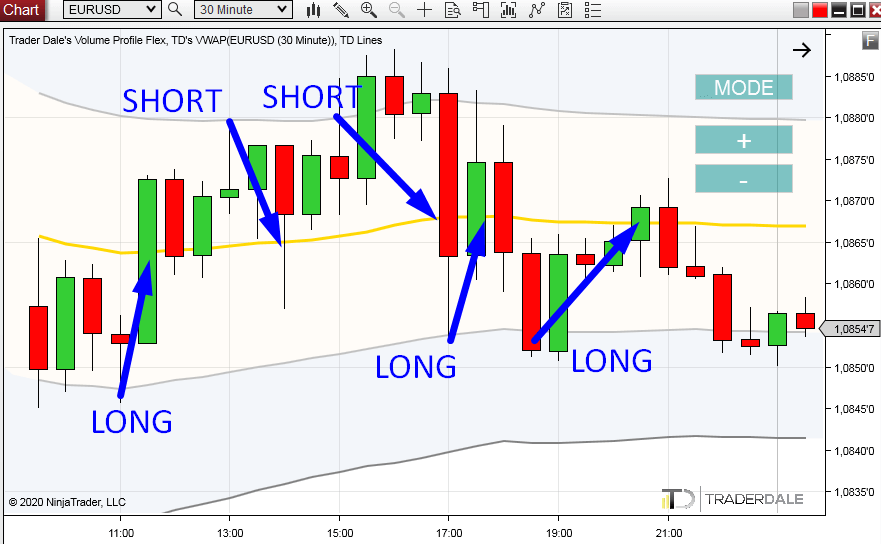
Many trading algorithms work like this: they BUY when the price is BELOW VWAP, and they SELL when the price is ABOVE VWAP.
You can image VWAP as a magnet:
Many trading algorithms work like this: they BUY when the price is BELOW VWAP, and they SELL when the price is ABOVE VWAP.
You can image VWAP as a magnet:
VWAP deviations
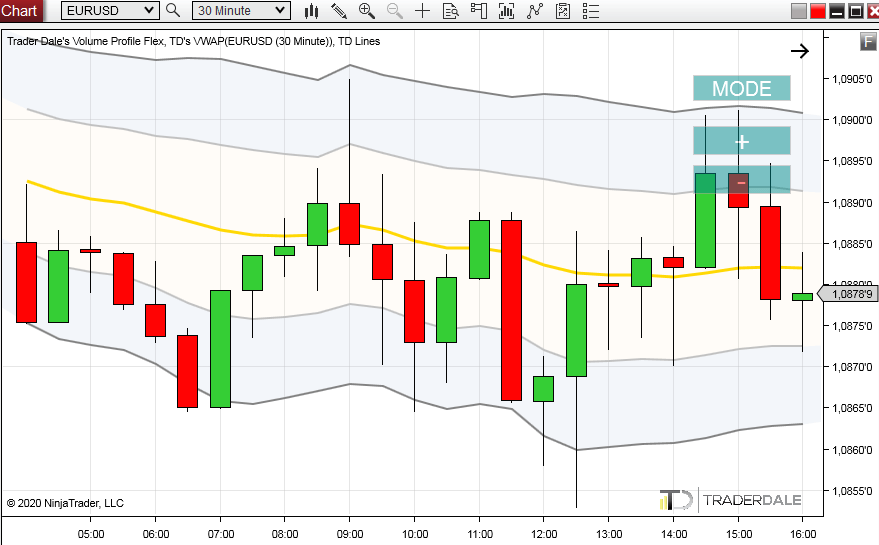
The VWAP indicator which I developed has also the option to calculate 1st and 2nd VWAP deviations. Those are standard deviations calculated from the VWAP and they are really useful. In fact, most of my VWAP trading strategies are based on deviations!They look like this:
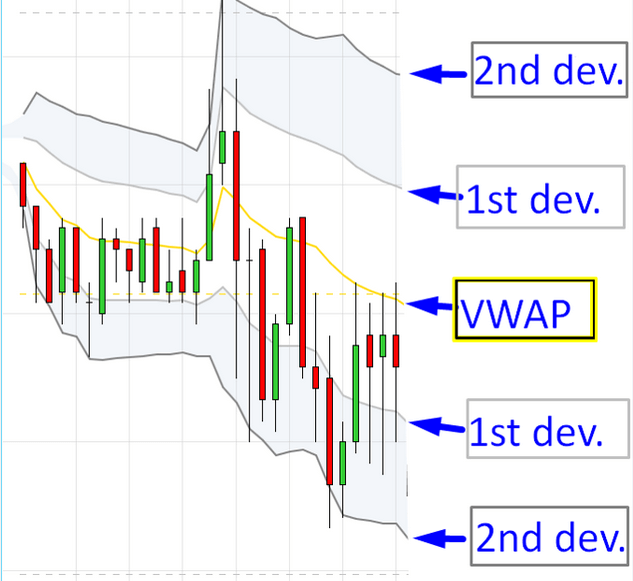
Deviations are calculated form VWAP, but they are a way more responsive to price and volume changes. For example, when a new trend starts to form then it will first show on Deviations.
This is the first way how to use Deviations:
This is the first way how to use Deviations:
Use VWAP deviations to identify TREND and ROTATION
When the Deviations move sideways (horizontally), then there is a ROTATION:
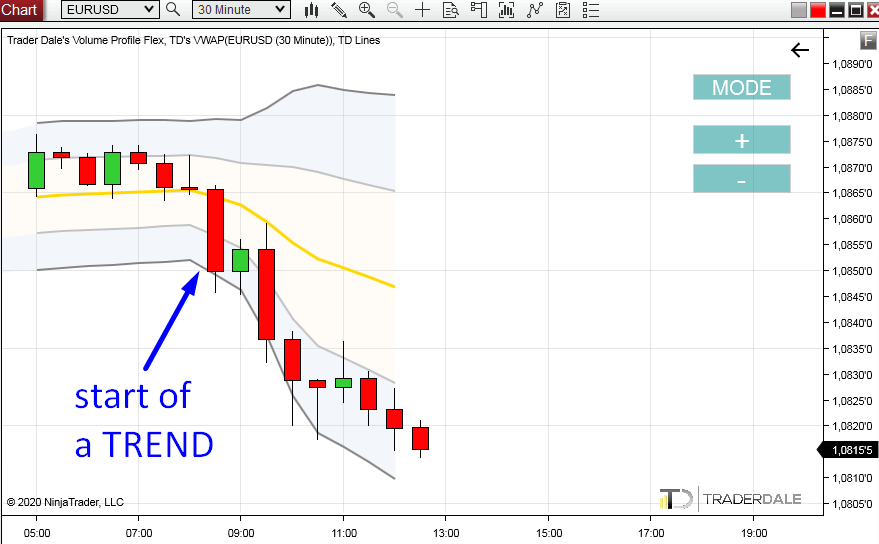
When the Deviations move upwards or downwards (vertically), then there is a TREND:
Sometimes,
you can tell whether there is ROTATION or a TREND by just looking at
the simple price chart. But there are cases when it is not so clear.
Let me explain:
A healthy trend needs to be volume driven. There needs to be big money behind the move (the big guys need to join the party). VWAP and its Deviations reflect that because they track VOLUMES . That’s why they are so good at revealing trends!
Let me explain:
A healthy trend needs to be volume driven. There needs to be big money behind the move (the big guys need to join the party). VWAP and its Deviations reflect that because they track VOLUMES . That’s why they are so good at revealing trends!
Use VWAP Deviations as Supports and Resistances
In my
trading, I like to use the Deviations as Supports and Resistances. The
price has nice reactions to them. Especially to the 1st Deviation, which
I like to use the most in my trading strategies.
A good place for a Take Profit is the yellow VWAP line. The reason is that it works as a magnet – the price tends to return to it.
A good place for a Take Profit is the yellow VWAP line. The reason is that it works as a magnet – the price tends to return to it.
Are there any simple VWAP trading strategies I can learn?
Yes there are!I will show you these strategies step-by-step in my next VWAP article that will follow soon!
Where do I get VWAP?
You can get it as a part of my educational package called the Elite Pack, or you can purchase it separately at the bottom of this page:
Dale’s Volume Profile & VWAP Training
Happy trading!
-Dale
Dale’s Volume Profile & VWAP Training
Happy trading!
-Dale
- Get link
- X
- Other Apps
- Get link
- X
- Other Apps

Comments
Post a Comment