
NZD/JPY: Volume Profile and Price Action Analysis


Trader Dale - Free Book

Hello guys,

today I will have a closer look at the NZD/JPY.

Since the start of today’s Asian session, there has been a strong uptrend. It seems that strong Buyers are pushing (manipulating) the price to go higher.

What happened before this trend? There was a rotation. The price was moving in a tight price channel.


Volume Profile Analysis

I used my Flexible Volume Profile indicator to look into this whole area to see how volumes were distributed there.

In the picture below, you can see that there were heavy volumes traded (accumulated) within the rotation area. From there the uptrend started.

Those heavy volumes tell us that it were likely BIG institutional traders who were building up their Longs slowly & unnoticed in that rotation. From there they manipulated the price upwards to make those Longs profitable.

NZD/JPY, 30 Minute chart:

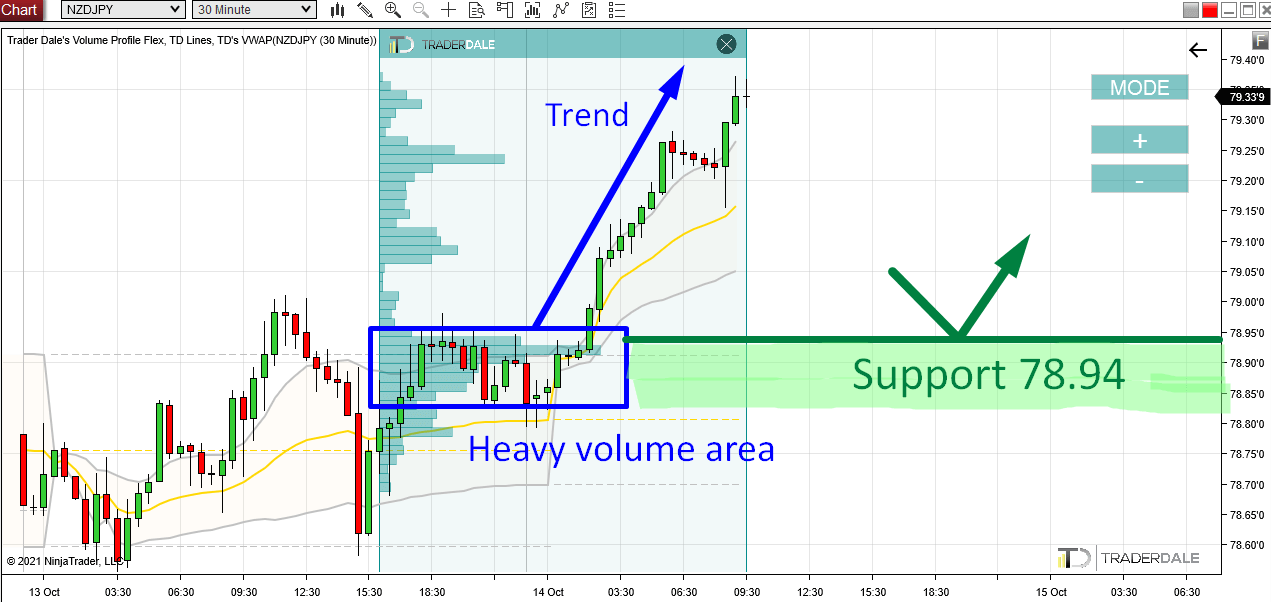
This heavy volume zone starting around 78.94 is now important for them because they placed a lot of their trades there.

When the price makes a pullback there again (at some point in the future), then it is likely that those strong Buyers will become active again = they will start buying again. They will try to manipulate the price to go upwards again.

This is what will make the area starting around 78.94 a strong Support zone.

This is one of my favorite Volume Profile setups and you can learn all about it in my Volume Profile Trading Course.

Do you want ME to help YOU with your trading?

Join one of my Volume Profile Educational courses and get my private trading levels, 15 hours of video content, my custom made Volume Profile indicators, and more!

Price Action Analysis

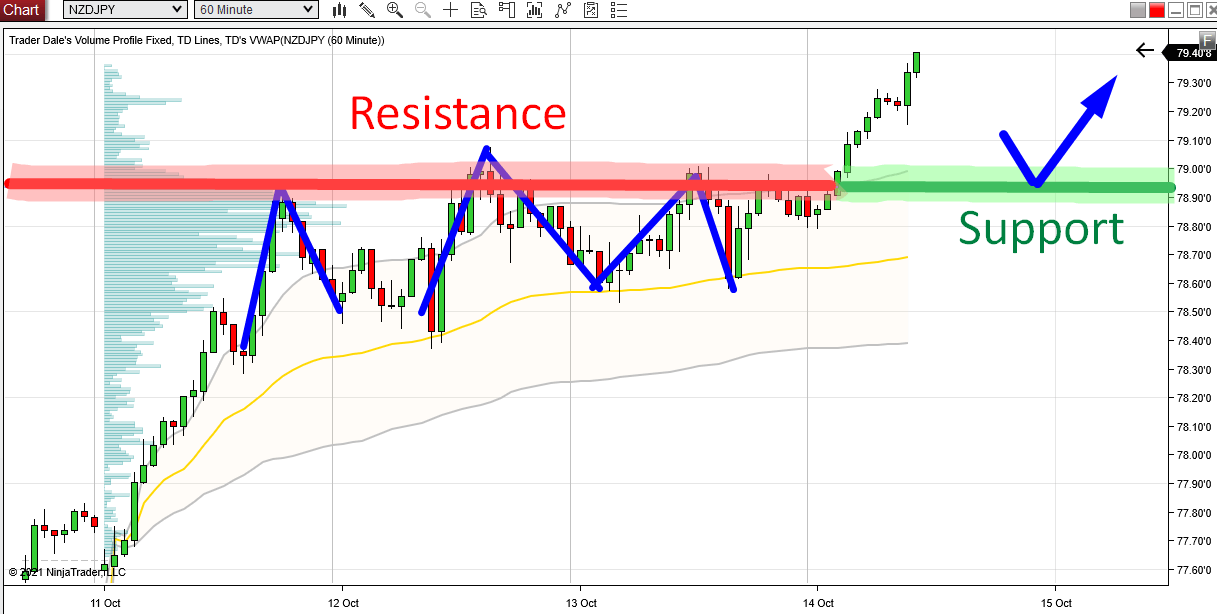
Additionally to this, there is also one more trading setup pointing to the 78.94 area.

It is a Price Action setup called which says that a breached Resistance becomes a Support.

If you look at the picture below, then you can see that the price already bounced off this 78.94 area three times earlier this week.

This means that it worked as a strong Resistance.

This Resistance got breached today and this turned it into a Support.

As you can see both the setups – Volume Profile and Price Action point to the same Support zone around 78.94.

This is a nice confluence and it adds strength to the Support. I like to look for such confluences whenever possible. The more, the better!

NZD/JPY, 60 Minute chart:

I hope you guys liked my analysis! Let me know what you think in the comments below!

Happy trading,

-Dale

Comments

Popular posts from this blog

Bitcoin is Dropping Hard! Here’s Where Smart Money Will Buy Again

Video Transcript: Hello everyone, it’s Dale here. In today’s video, I’d like to talk about Bitcoin. The reason is that Bitcoin has been dropping like crazy, and a lot of traders are wondering where Bitcoin will go and what to expect. If I look at the chart and use Volume Profile, I would say that it’s pretty straightforward because Volume Profile very clearly shows the strongest support and resistance levels. So, let’s take a look at the chart, and let me show you. What you see before you is the daily chart of Bitcoin. This is the big picture, and as you can see, from the all-time high here, Bitcoin experienced quite a significant sell-off and is currently dropping. Right now, I don’t really see any strong support that would stand in the way of this strong sell-off. Let me use Volume Profile and show you what could actually stop the sell-off of Bitcoin. All right, so what I’m going to do is apply Volume Profile over this whole area to see the volume distribution. As you can see, there ...

Beginners Guide to Order Flow PART 1: What Is Order Flow?

DEFINITION: Order Flow is an advanced charting software which enables you to read all trading orders that are processed in the market. It helps to track the BIG financial institutions through the trades they make. Most people get confused when they open up a chart with Order Flow for the first time. There is no shame in that. Order Flow shows so many information and it is easy to get overwhelmed and confused if you don’t know what to look for! This Beginners Guide will teach you how to understand how Order Flow works and how you can use it in your trading! In this 1st part of the Order Flow Guide I will show you around the Order Flow interface. Footprints The Order Flow does not show standard candles, but it shows FOOTPRINTS . A footprint shows not only Open, High, Low, Close (as standard candles) but it also shows orders traded in that candle. Orders can be...

Quick In & Out Trade on USD/JPY – Smart Money Concepts & Volume Profile

Video Transcript: Hello everyone, it’s Dale here. Welcome to the next video of the new series, where I’ll talk about my recent trades. Today’s trade is on the  USD/JPY . It was a very quick in-and-out trade, so let’s check it out. What you see before you is the 30-minute chart of the  USD/JPY , and the level I was trading from was this short level at  149.63 . The reasoning behind this level—let me zoom in a little so you can see this better—was the volumes that formed here. From this place, there was a sharp sell-off. Even though the volumes do not particularly stand out, what’s important is that from this zone, there was a strong sell-off. There was also a  Fair Value Gap . My software highlights that, but when the gap is filled, it’s not highlighted anymore. If I mark it for you, this was the Fair Value Gap, which is a setup from Smart Money Concepts. I like to trade from the beginning of the Fair Value Gap, which is here. This is also the beginning of a heavy vol...