
AUD/CHF: Volume Profile and Price Action Analysis


Hello guys,

in today’s day trading analysis I will have a closer look at the AUD/CHF.

This is actually my second one (on AUD/CHF) this week. I have already made an analysis of the AUD/CHF on Monday. Here is the Prediction & Result:

You can check out the original analysis here:

Volume Profile Trading Ideas: Trading The Weekly Point Of Control

AUD/CHF: Volume Profile Analysis

Since the nice reaction to our Support from Monday, the AUD/CHF has been in a steep uptrend.

Trends like this often give nice trading opportunities.

When I see such a trend I always use my Flexible Volume Profile indicator to look how volumes were distributed within the trend.

What I look for are significant volume zones = Volume Clusters.

As you can see in the below, there is a strong Volume Cluster around 0.6869.

Such a place represents a strong Support.

AUD/CHF; 30 Minute chart:

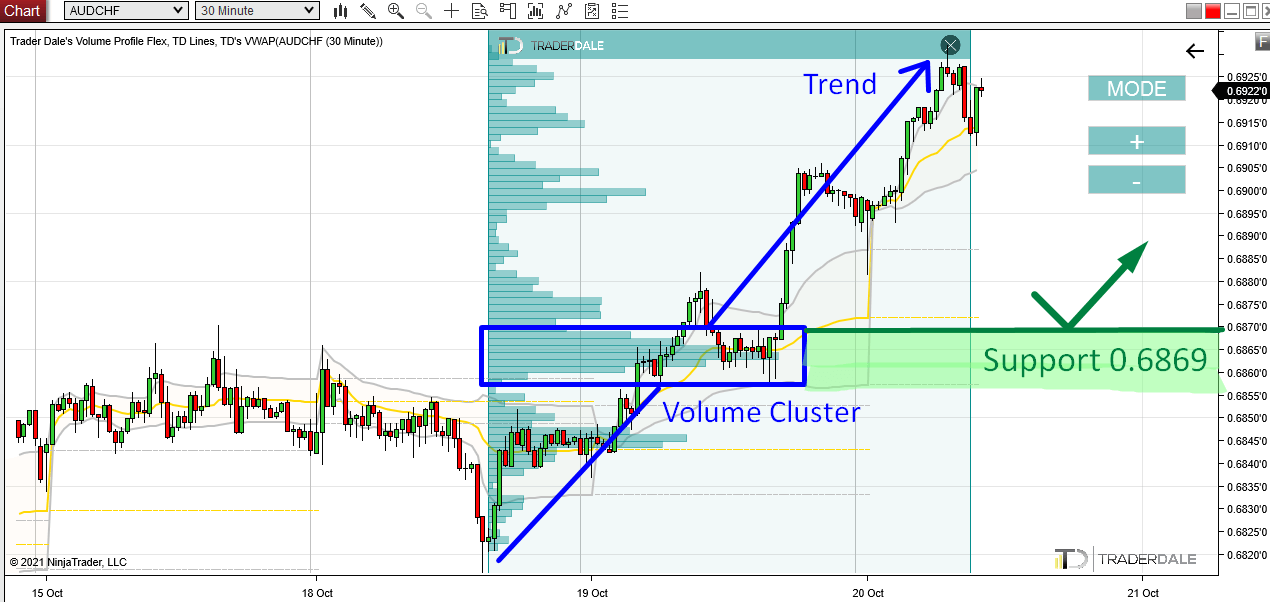
What it tells us is that the strong institutional Buyers who were pushing and manipulating the price upwards were adding to their Longs there. The heavy volumes we see, that’s them.

This is an important information because when the price makes a pullback into this heavy volume area again, then it is likely that those Buyers will become active here again.

What does it mean “become active”? it means that they will want to enter more Longs there, defend this zone, and finally push the price upwards again.

This is what should make this area a strong Support.

This Volume Profile setup is called the “Trend Setup” and you can learn all there is about it in my Volume Profile Trading Course.

Do you want ME to help YOU with your trading?

Join one of my Volume Profile Educational courses and get my private trading levels, 15 hours of video content, my custom made Volume Profile indicators, and more!

AUD/CHF: Price Action Analysis

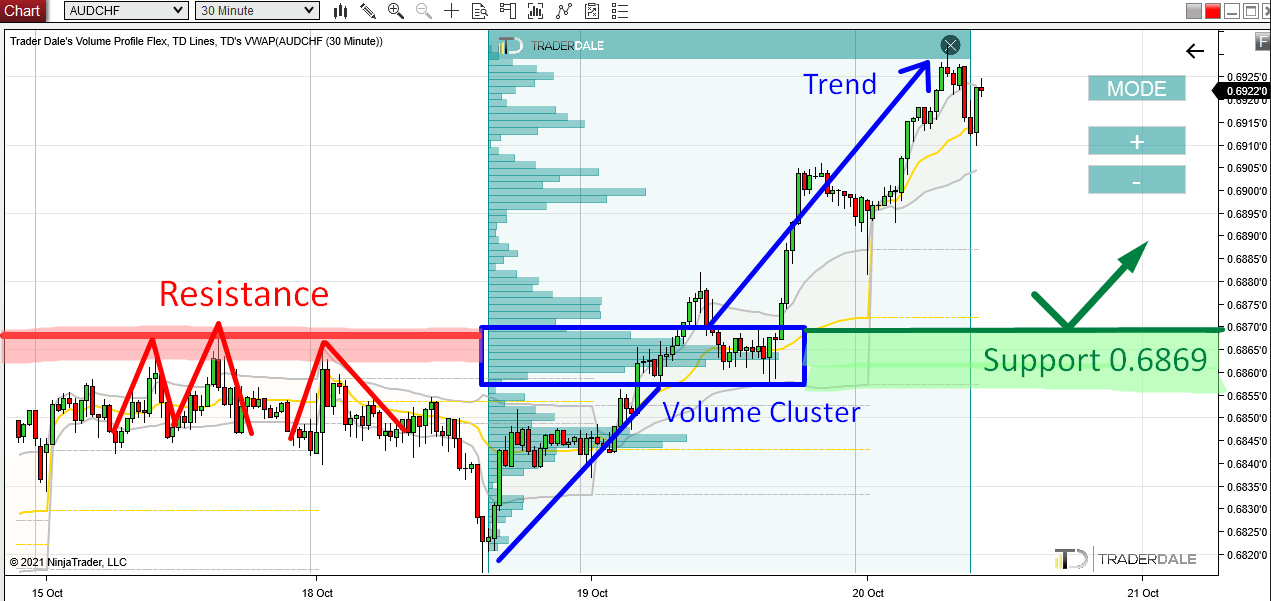
Apart from the Volume Profile setup, there is also a Price Action Setup pointing to the same Support at 0.6869.

This Price Action setup says that a breached Resistance becomes a Support.

As you can see in the picture below, our Support worked as a strong Resistance in the past. The price bounced off it three times.

Yesterday, the Resistance got breached and it became a Support.

This Support is especially strong because there is a double confirmation: The Price Action setup points to the same Support as the Volume Profile setup.

AUD/CHF; 30 Minute chart:

I hope you guys liked my analysis! Let me know what you think in the comments below!

Happy trading,

-Dale

Comments

Popular posts from this blog

Bitcoin is Dropping Hard! Here’s Where Smart Money Will Buy Again

Video Transcript: Hello everyone, it’s Dale here. In today’s video, I’d like to talk about Bitcoin. The reason is that Bitcoin has been dropping like crazy, and a lot of traders are wondering where Bitcoin will go and what to expect. If I look at the chart and use Volume Profile, I would say that it’s pretty straightforward because Volume Profile very clearly shows the strongest support and resistance levels. So, let’s take a look at the chart, and let me show you. What you see before you is the daily chart of Bitcoin. This is the big picture, and as you can see, from the all-time high here, Bitcoin experienced quite a significant sell-off and is currently dropping. Right now, I don’t really see any strong support that would stand in the way of this strong sell-off. Let me use Volume Profile and show you what could actually stop the sell-off of Bitcoin. All right, so what I’m going to do is apply Volume Profile over this whole area to see the volume distribution. As you can see, there ...

Quick In & Out Trade on USD/JPY – Smart Money Concepts & Volume Profile

Video Transcript: Hello everyone, it’s Dale here. Welcome to the next video of the new series, where I’ll talk about my recent trades. Today’s trade is on the  USD/JPY . It was a very quick in-and-out trade, so let’s check it out. What you see before you is the 30-minute chart of the  USD/JPY , and the level I was trading from was this short level at  149.63 . The reasoning behind this level—let me zoom in a little so you can see this better—was the volumes that formed here. From this place, there was a sharp sell-off. Even though the volumes do not particularly stand out, what’s important is that from this zone, there was a strong sell-off. There was also a  Fair Value Gap . My software highlights that, but when the gap is filled, it’s not highlighted anymore. If I mark it for you, this was the Fair Value Gap, which is a setup from Smart Money Concepts. I like to trade from the beginning of the Fair Value Gap, which is here. This is also the beginning of a heavy vol...

ORDER FLOW: How to Trade the Absorption Setup (Trade Entry Confirmation)

Video Transcript: Hello everyone, and in this video, I’d like to talk about order flow and one of my favorite confirmation setups in order flow. The confirmation setup is called the absorption, and I’ll show you an example of a trade I made a couple of days ago. I think this is the perfect example of how you can use the absorption setup to confirm your trade entry. So, let’s take a look at it. First, let me start by showing you the level I wanted to trade, and then I’ll show you the absorption setup. You’re looking at the  EUR/USD  30-minute chart, and I had a long level here, marked by this line. This was a long level based on a Volume Profile setup, focusing on those heavy volumes formed within this important rejection. So, this was the long level. What happened was that the price started to go into a sudden sell-off, and there wasn’t really any strong macro news behind this. I wasn’t really sure what was going on, but there was this sudden sell-off, this spike move. Because...