
 

Hello guys,

today, I would like to have a closer look at the AUD/JPY.

It seems, there has been a change in the trend. From a downtrend to an uptrend.

What happened at the lowest breaking point where the trend changed? There was a rotation with heavy volumes accumulated there. You can see those volumes nicely with my Volume Profile indicator.

What do those volumes tell us? They tell us that in this place, strong institutional Buyers were absorbing all the selling pressure, and buying everything the Sellers had to sell.

The Buyers were accumulating their Long trades there.

After they entered their huge trading positions they pushed the price into the new uptrend. Now it’s Buyers who is in control and who is pushing the price upwards.

AUD/JPY; 30 Minute chart:
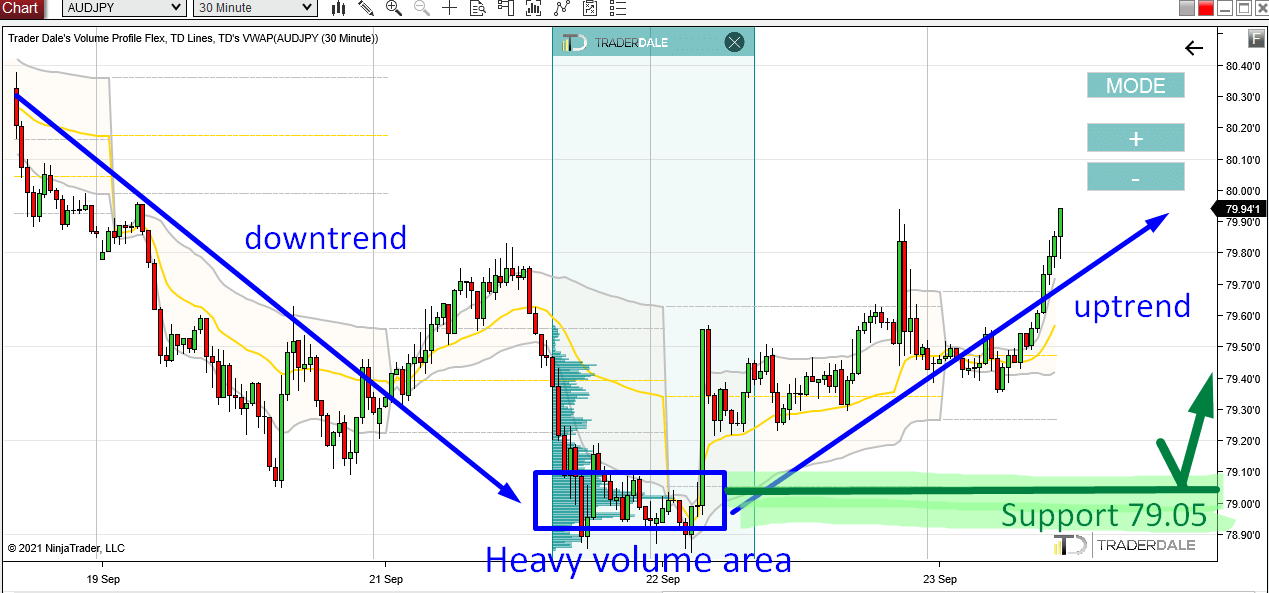
Support at 79.05

What happens when the price returns back into the heavy volume area – the area where those strong Buyers were placing most of their Longs?

Those Buyers will most likely want to defend this place as it is important for them (they placed a lot of their trades there).

So, if the price makes it back to the heavy volume zone around 79.05, then it is likely that those Buyers will use aggressive Market Orders to manipulate the price to go upwards again. That’s how they will defend this zone.

What if those Buyers won’t actively defend this zone anymore? Then there is still a chance this Support will work.

The reason is that the BIG guys (trading institutions) know that this was an important volume-based zone and they will be afraid to try and push through. It would be risky for them to risk a potential fight with strong Buyers.

They rather quit their Short trades if the price comes close to this Support area around 79.05.

Those are the two reasons I think the zone around 79.05 will work as a strong Support.

This trading setup I used here is called the “Volume Profile – Accumulation Setup” and you can learn more about it in my trading course (click the green banner below):

Do you want ME to help YOU with your trading?

Join one of my Volume Profile Educational courses and get my private trading levels, 15 hours of video content, my custom made Volume Profile indicators, and more!

I hope you guys liked my analysis! Let me know what you think in the comments below!

Happy trading,

-Dale

Comments

Popular posts from this blog

Bitcoin is Dropping Hard! Here’s Where Smart Money Will Buy Again

Video Transcript: Hello everyone, it’s Dale here. In today’s video, I’d like to talk about Bitcoin. The reason is that Bitcoin has been dropping like crazy, and a lot of traders are wondering where Bitcoin will go and what to expect. If I look at the chart and use Volume Profile, I would say that it’s pretty straightforward because Volume Profile very clearly shows the strongest support and resistance levels. So, let’s take a look at the chart, and let me show you. What you see before you is the daily chart of Bitcoin. This is the big picture, and as you can see, from the all-time high here, Bitcoin experienced quite a significant sell-off and is currently dropping. Right now, I don’t really see any strong support that would stand in the way of this strong sell-off. Let me use Volume Profile and show you what could actually stop the sell-off of Bitcoin. All right, so what I’m going to do is apply Volume Profile over this whole area to see the volume distribution. As you can see, there ...

Beginners Guide to Order Flow PART 1: What Is Order Flow?

DEFINITION: Order Flow is an advanced charting software which enables you to read all trading orders that are processed in the market. It helps to track the BIG financial institutions through the trades they make. Most people get confused when they open up a chart with Order Flow for the first time. There is no shame in that. Order Flow shows so many information and it is easy to get overwhelmed and confused if you don’t know what to look for! This Beginners Guide will teach you how to understand how Order Flow works and how you can use it in your trading! In this 1st part of the Order Flow Guide I will show you around the Order Flow interface. Footprints The Order Flow does not show standard candles, but it shows FOOTPRINTS . A footprint shows not only Open, High, Low, Close (as standard candles) but it also shows orders traded in that candle. Orders can be...

Quick In & Out Trade on USD/JPY – Smart Money Concepts & Volume Profile

Video Transcript: Hello everyone, it’s Dale here. Welcome to the next video of the new series, where I’ll talk about my recent trades. Today’s trade is on the  USD/JPY . It was a very quick in-and-out trade, so let’s check it out. What you see before you is the 30-minute chart of the  USD/JPY , and the level I was trading from was this short level at  149.63 . The reasoning behind this level—let me zoom in a little so you can see this better—was the volumes that formed here. From this place, there was a sharp sell-off. Even though the volumes do not particularly stand out, what’s important is that from this zone, there was a strong sell-off. There was also a  Fair Value Gap . My software highlights that, but when the gap is filled, it’s not highlighted anymore. If I mark it for you, this was the Fair Value Gap, which is a setup from Smart Money Concepts. I like to trade from the beginning of the Fair Value Gap, which is here. This is also the beginning of a heavy vol...