
EUR/AUD: Volume Profile and Price Action Analysis


Hello guys,

today, I would like to have a closer look at EUR/AUD.

There has been an interesting development as the trend completely changed from downtrend to uptrend. Also, the change of trends was quite rapid. There was a strong sell-off, and then just after a few hours of rotation a strong buying activity took place.

When there is such an aggressive change of a trend, then I am always interested in the volume distribution within the strong rejection area. I am most interested in the volumes that got traded right before the change of trend occurred. For this, I use my custom-made Volume Profile tool.

One of the handy features my Volume Profile has is that you can use it to look into specific areas in the chart which you are interested in. Just like the rejection here.

EUR/AUD; 30 Minute chart:

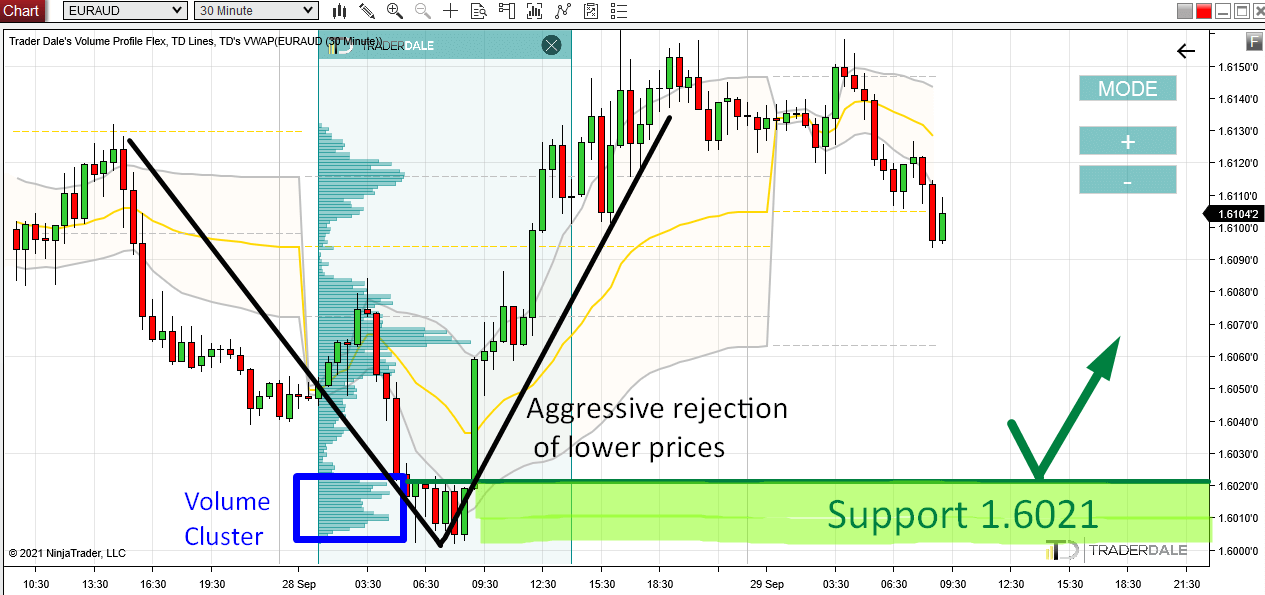
As you can see in the picture above, I used the Volume Profile to look into the rejection – into the area where the trend changed. That’s the most important zone.

The Volume Profile revealed a significant volume zone – a volume cluster that got formed just before the trend changed.

Significant Volume Cluster

What does this volume cluster tell us? It tells us, that at this place heavy volumes were traded. Buyers were buying everything the Sellers had to sell. They were buying aggressively and when the Sellers ran out of fuel, the price shot upwards. Strong institutional Buyers pushed it there – it’s those guys that changed the trend.

When the price makes it back into this rejection zone again at some point in the future then we can expect those strong institutional Buyers to defend this zone again.

This zone is clearly important for them since they were buying there as crazy before.

So, when the price makes it back to the volume cluster zone starting at 1.6021, those Buyers should start aggressive buying activity (using Market Orders) and push the price upwards again.

This should make the zone around the volume cluster a strong day trading Support.

The Volume Profile setup I used here is called the “Rejection Setup” and you can learn more about how to trade it in my Volume Profile Trading Course.

I hope you guys liked my analysis! Let me know what you think in the comments below!

Happy trading,

-Dale

Prediction → Result

P.S. Did you take that trade based on the analysis from Monday? This one:

Volume Profile Trading Ideas – 27th September 2021

Here is the Prediction from the analysis and Result:

Comments

Popular posts from this blog

Recent Trade Breakdown: Combining Price Action & Volume Profile for Smarter Trades

Video Transcript: Hello everyone, it’s Dale here. In this new video series, I want to break down my recent trades. The goal of this series is to show you how I use my Volume Profile trading setups every day in real market conditions, so you can learn from both my wins and my mistakes. If you find this helpful, don’t forget to hit the like and subscribe buttons. Let’s dive in. What you see before you is a screenshot from my session yesterday. It’s taken from the live trading room we held in the  Funded Trader Academy . During that session, a new setup was forming on the  AUD/USD . This is the  AUD/USD  on a 30-minute timeframe, and the new setup was forming right here. There was a resistance level forming around  0.6364 . The reason behind this setup was based on a couple of factors. The main reason was a Volume Profile setup. If you look here at what I’ve highlighted, this area represents a heavy volume zone, which the resistance level was based on. You can see ...

🎯 Top Volume Profile Levels to Trade This Week – 11th November 2024

Do you want ME to help YOU with your trading? Learn my proven Volume Profile & Order Flow trading strategies! Get my proprietary indicators and start making progress. We even set the indicators up for you so you can hit the ground running TODAY! Start Learning to Trade Now! Video Transcript: Hello, everyone! It’s Dale here with a new weekly trading ideas video. What you see before you is the chart from NinjaTrader 8 platform with my custom-made Volume Profile and VWAP indicators. This is the chart of  EUR/USD  on the 30-minute timeframe. I am strongly short-biased on the Euro because I see a strong sell-off as a reaction to the election. This strong sell-off, combined with the fundamentals of the U.S. presidential election, suggests that I should focus more on shorts for this pair. This means I use the Volume Profile over the recent area to look for significant volume zones. If you examine how the volumes were distributed this past Friday, there are two significant volume ...

Bitcoin is Dropping Hard! Here’s Where Smart Money Will Buy Again

Video Transcript: Hello everyone, it’s Dale here. In today’s video, I’d like to talk about Bitcoin. The reason is that Bitcoin has been dropping like crazy, and a lot of traders are wondering where Bitcoin will go and what to expect. If I look at the chart and use Volume Profile, I would say that it’s pretty straightforward because Volume Profile very clearly shows the strongest support and resistance levels. So, let’s take a look at the chart, and let me show you. What you see before you is the daily chart of Bitcoin. This is the big picture, and as you can see, from the all-time high here, Bitcoin experienced quite a significant sell-off and is currently dropping. Right now, I don’t really see any strong support that would stand in the way of this strong sell-off. Let me use Volume Profile and show you what could actually stop the sell-off of Bitcoin. All right, so what I’m going to do is apply Volume Profile over this whole area to see the volume distribution. As you can see, there ...