
NZD/USD: Volume Profile and Price Action Analysis


Hello guys,

I hope you didn’t miss yesterday’s video with trading ideas for this week! If you did, then check it out here:

Weekly Trading Ideas (30th August 2021)

Today, I would like to have a closer look at NZD/USD.

The reason I am interested in this pair is that there has been a strong uptrend action starting in the Asian session. Such action tells us, that there are strong and aggressive Buyers pushing the price upwards.

Volume Profile Analysis

Those Buyers most likely entered most of their Long positions the heavy volume area that got formed before the trend.

It is usually like this because the BIG trading institutions need to accumulate their massive trading positions in a rotation. That’s why there is always a rotation and then a trend (a pattern very often seen all across the markets).

If you use my Volume Profile tool, then you will see the heavy volume area very clearly.

NZD/USD; 30 Minute chart:

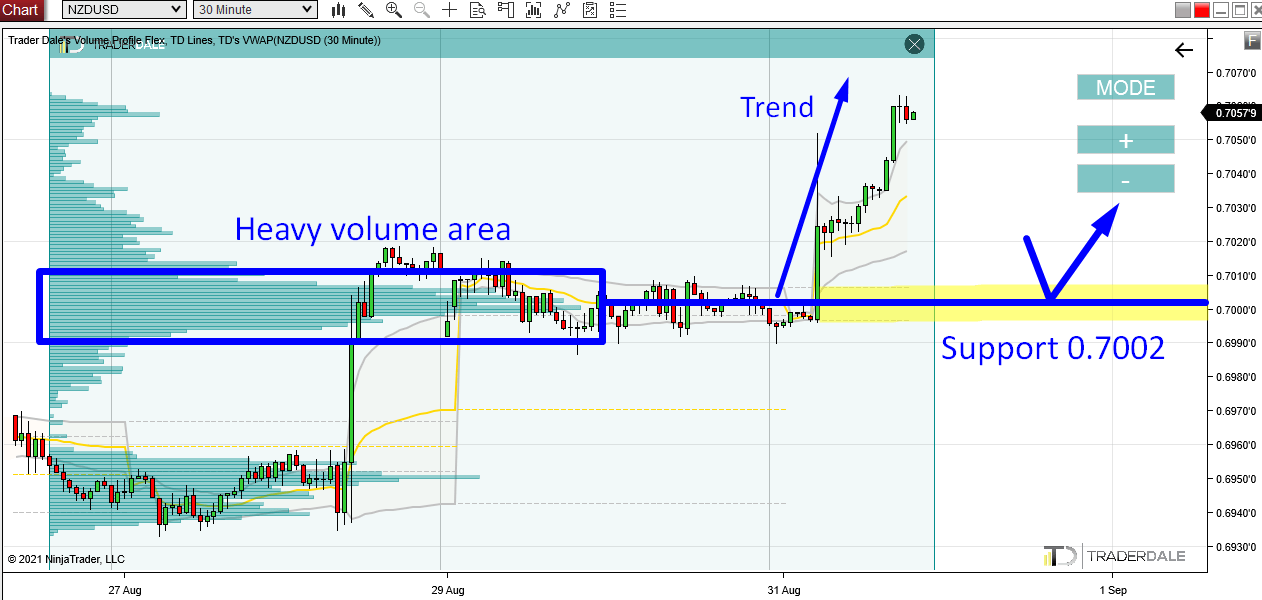
The information we now have is this: There were strong Buyers in a zone around 0.7002. those Buyers then pushed the price upwards aggressively.

If there is a pullback into this zone again (around 0.7002), then those strong Buyers should try and defend it.

This zone is important for them. The reason is that they placed a lot of their trades there – that’s why it’s important.

This is why it should work as a strong day-trading Support.

This Volume Profile setup is called the “Volume Accumulation Setup“.

Weekly Point Of Control (POC)

Another nice addition to this Support is that the zone around 0.7002 is also a Point Of Control (POC) of the current week. This means that the heaviest volumes this week (so far) were traded there.

The Weekly POC adds strength to our Support.

NZD/USD; 60 Minute chart, Weekly Volume Profile:

I hope you guys liked my analysis! Let me know what you think in the comments below!

Happy trading,

-Dale

Comments

Popular posts from this blog

How to Track The Institutions With Volume Profile – Weekly Trading Ideas 6.4.2020

*Disclaimer: Presented opinions, trades and trading ideas on the markets and charts is not advice nor a trading recommendation. It is general information and it is for educational purposes only. **You can learn more about my trading setups in my new book: VOLUME PROFILE: The insider’s guide to trading If you would like to learn to trade with Volume Profile and to trade with me every day, then join my Trading Course!

Bitcoin is Dropping Hard! Here’s Where Smart Money Will Buy Again

Video Transcript: Hello everyone, it’s Dale here. In today’s video, I’d like to talk about Bitcoin. The reason is that Bitcoin has been dropping like crazy, and a lot of traders are wondering where Bitcoin will go and what to expect. If I look at the chart and use Volume Profile, I would say that it’s pretty straightforward because Volume Profile very clearly shows the strongest support and resistance levels. So, let’s take a look at the chart, and let me show you. What you see before you is the daily chart of Bitcoin. This is the big picture, and as you can see, from the all-time high here, Bitcoin experienced quite a significant sell-off and is currently dropping. Right now, I don’t really see any strong support that would stand in the way of this strong sell-off. Let me use Volume Profile and show you what could actually stop the sell-off of Bitcoin. All right, so what I’m going to do is apply Volume Profile over this whole area to see the volume distribution. As you can see, there ...

Recent Trade Breakdown: Combining Price Action & Volume Profile for Smarter Trades

Video Transcript: Hello everyone, it’s Dale here. In this new video series, I want to break down my recent trades. The goal of this series is to show you how I use my Volume Profile trading setups every day in real market conditions, so you can learn from both my wins and my mistakes. If you find this helpful, don’t forget to hit the like and subscribe buttons. Let’s dive in. What you see before you is a screenshot from my session yesterday. It’s taken from the live trading room we held in the  Funded Trader Academy . During that session, a new setup was forming on the  AUD/USD . This is the  AUD/USD  on a 30-minute timeframe, and the new setup was forming right here. There was a resistance level forming around  0.6364 . The reason behind this setup was based on a couple of factors. The main reason was a Volume Profile setup. If you look here at what I’ve highlighted, this area represents a heavy volume zone, which the resistance level was based on. You can see ...