
Hello guys,
today, I would like to have a closer look at the CAD/JPY.
There has been quite a strong sell-off in the Asian session today. Such sell-off indicates strong and aggressive institutional Sellers manipulating the price downwards.
If you use my Flexible Volume Profile on the CAD/JPY chart, then you will see, that there were massive volumes accumulated around 86.76.
This is also the place where the strong sell-off started.
It appears, that strong institutional Sellers were building up their Short positions in that rotation around 86.76 and then they manipulated the price downwards.
CAD/JPY; 30 Minute chart:
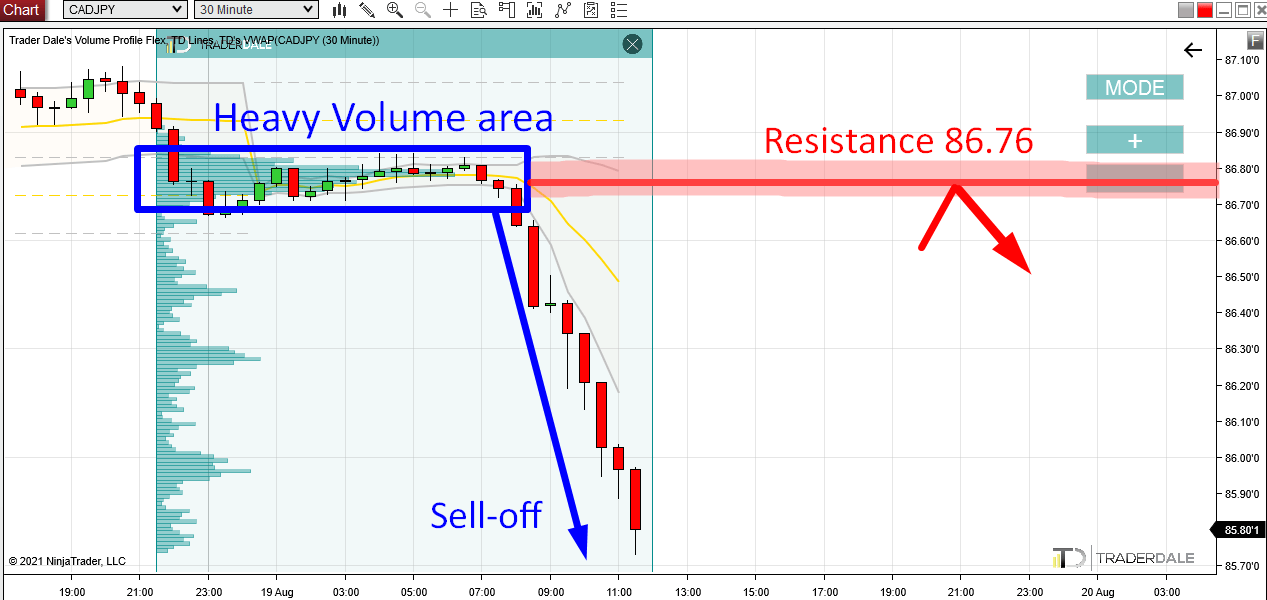
Now we know, that there were strong Sellers around 86.76 and that they placed a lot of their Short positions there.
When the price makes a pullback into this area again, then it should work as a strong Resistance.
The reason is that the strong Sellers should defend this zone as it is important for them. Why? Because they placed a lot of their shorts there before.
They will defend it by placing aggressive Market Orders in order to push the price downwards from this place again.
This is what will make the zone around 86.76 a strong day-trading Resistance.
The setup i used here is called the “Volume Profile: Accumulation Setup”.
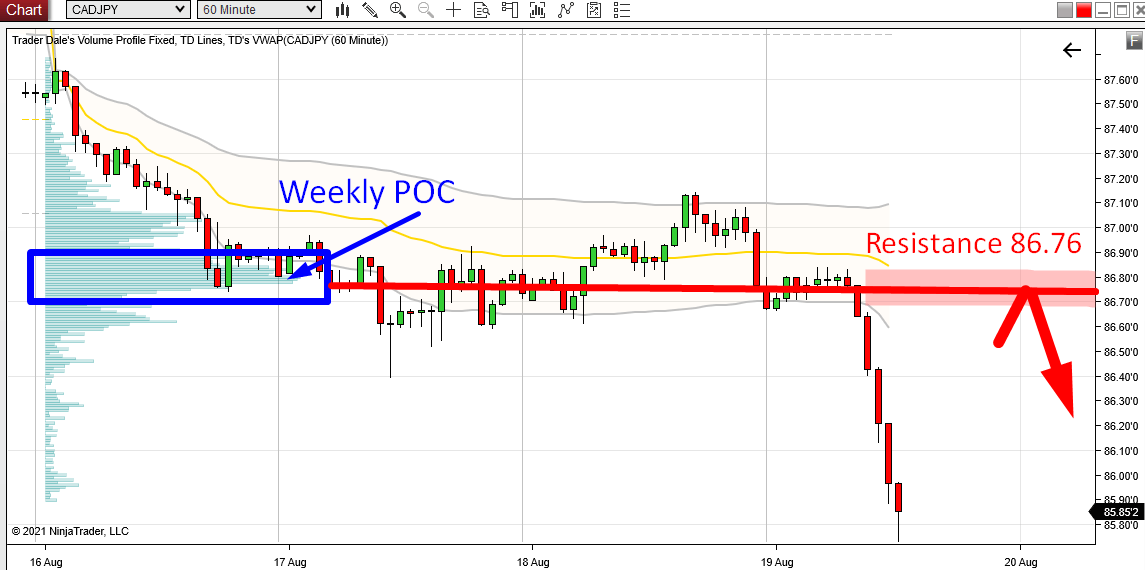
Weekly Point Of Control (POC)
A nice addition to this, is that the zone around 86.76 is also the Weekly Point Of Control (POC).
This means that the heaviest volumes throughout the current week have been traded there.
Weekly POC is by itself a very strong zone the market reacts to.
Here, it also adds strength to our 86.76 Resistance.
CAD/JPY; 60 Minute chart:
I hope you guys liked my analysis! Let me know what you think in the comments below!
Happy trading,
-Dale
- Get link
- X
- Other Apps
- Get link
- X
- Other Apps
Comments
Post a Comment