
Activision Blizzard: How To Do A Stock Analysis With Volume Profile


Hello guys,

before I go into today’s analysis, I would like to invite you to a special webinar that I am going to have tomorrow –  Thursday (12th). The topic of the webinar is going to be “Long-Term Investing With Volume Profile“.

Register your FREE seat using this link:

https://bit.ly/374RvwJ

In today’s analysis, I am going to talk about a long-term trading opportunity on Activision Blizzard (ATVI) stock.

ATVI – Company Profile And Current Problems

ATVI is a company merged from two companies Activision and Blizzard. Both companies make computer games. Blizzard made games like World Of Warcraft, Diablo, Starcraft, … I would say it is a legendary game studio that every person who plays or played computer games knows.

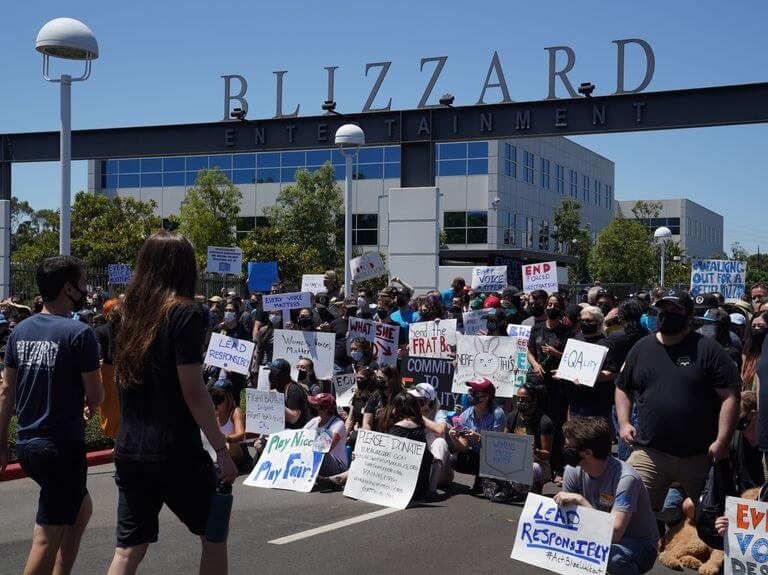
Blizzard is currently having some problems as lots of their employees went on strike, because they did not like how the company was treating them.

If you start reading the news then you will see that there is quite a lot of the bad stuff that came up and that the company needs to deal with.

Even though the company is going through tough times now, I don’t think this is something from which they can’t recover. Also, a lot of the bad stuff is related more to single “scandals” and not to the overall economic state and health of the company.

Blizzard still has strong and huge fan support and a very good business model. The strikes and the problems the company is facing now hasn’t affected that (yet).

Still, those current problems made the ATVI stock drop from around $100 to $80 per share. I think this could be a nice opportunity to buy a good stock for a nice discount 🙂

Why do I think now could be the good time? Let me explain…

ATVI: Volume Profile Analysis

The price of ATVI stock has been in a strong uptrend since 2019.

I used my Flexible Volume Profile indicator to see how volumes were distributed throughout the uptrend area.

As you can see from the picture below, there was a significant heavy volume area around 79.00.

This means that the BIG trading institutions who were driving the price of ATVI higher and higher were adding massively to their Long positions there. This was a very important zone for them.

What happened now, is that due to the problems the company is facing the price dropped right into the heavy volume area.

This heavy volume area should now work as a strong Support as those BIG institutions who were adding to their Longs there before should defend this zone.This zone is important for them – lot of their money is there!

The chart below is a Weekly chart and there has already formed a pinbar exactly at the 79.00 Support. This could mean the buying reaction has already started.

The Volume Profile setup I used there is called the “Trend Setup“.

ATVI, Weekly chart:

Price Action Setup

A nice addition to the Trend Setup is also a Price Action setup.

This Price Action setup says that a broken Resistance becomes a Support.

If you look at the chart below, then you can see that the area around 79.00 has already worked as a very strong Resistance in the past. The price bounced off it three times. Each reaction was a very strong one.

Then at the end of 2020 this Resistance got breached and it became a Support – the Support the price is currently testing.

ATVI, Weekly chart:

What is nice about this is that the two setups – Volume Profile and Price Action align and both point to the same Support area around 79.00

Summary

How I currently see it is that employee problems in the company caused a drop of the stock. The problems were only in one of the merged companies – in Blizzard. Not in Activision.

I believe that the company is strong and that this won’t affect their sales too much.

The price has now dropped to a significant Support and I think this might be a nice opportunity to buy a good company for a discounted price.

Still, the problems could start to pile up and for that reason, I would advise you to be careful and if you decide to invest in ATVI now, then do so with a smaller trading position.

I hope you guys liked my analysis! Let me know what you think in the comments below!

Happy trading,

-Dale

Comments

Popular posts from this blog

How to Track The Institutions With Volume Profile – Weekly Trading Ideas 6.4.2020

*Disclaimer: Presented opinions, trades and trading ideas on the markets and charts is not advice nor a trading recommendation. It is general information and it is for educational purposes only. **You can learn more about my trading setups in my new book: VOLUME PROFILE: The insider’s guide to trading If you would like to learn to trade with Volume Profile and to trade with me every day, then join my Trading Course!

Recent Trade Breakdown: Combining Price Action & Volume Profile for Smarter Trades

Video Transcript: Hello everyone, it’s Dale here. In this new video series, I want to break down my recent trades. The goal of this series is to show you how I use my Volume Profile trading setups every day in real market conditions, so you can learn from both my wins and my mistakes. If you find this helpful, don’t forget to hit the like and subscribe buttons. Let’s dive in. What you see before you is a screenshot from my session yesterday. It’s taken from the live trading room we held in the  Funded Trader Academy . During that session, a new setup was forming on the  AUD/USD . This is the  AUD/USD  on a 30-minute timeframe, and the new setup was forming right here. There was a resistance level forming around  0.6364 . The reason behind this setup was based on a couple of factors. The main reason was a Volume Profile setup. If you look here at what I’ve highlighted, this area represents a heavy volume zone, which the resistance level was based on. You can see ...

ORDER FLOW: How to Trade the Absorption Setup (Trade Entry Confirmation)

Video Transcript: Hello everyone, and in this video, I’d like to talk about order flow and one of my favorite confirmation setups in order flow. The confirmation setup is called the absorption, and I’ll show you an example of a trade I made a couple of days ago. I think this is the perfect example of how you can use the absorption setup to confirm your trade entry. So, let’s take a look at it. First, let me start by showing you the level I wanted to trade, and then I’ll show you the absorption setup. You’re looking at the  EUR/USD  30-minute chart, and I had a long level here, marked by this line. This was a long level based on a Volume Profile setup, focusing on those heavy volumes formed within this important rejection. So, this was the long level. What happened was that the price started to go into a sudden sell-off, and there wasn’t really any strong macro news behind this. I wasn’t really sure what was going on, but there was this sudden sell-off, this spike move. Because...