
EUR/GBP: Volume Profile, VWAP, and Price Action Analysis


Trader Dale - Free Book

Hello guys,

today, I will do an intraday trading analysis of the EUR/GBP.

There was a pretty interesting development yesterday. There was a rotation, and then a strong buying activity (uptrend).

This tells me that:

  1. There were strong Buyers building up their Long positions in the rotation area
  2. Then those Buyers pushed the price aggressively upwards (that’s the uptrend).

I used my Flexible Volume Profile to look into this area to see how the volumes were distributed there.

As you can see from the picture below, there were heavy volumes accumulated in the rotation area. Those are the strong Buyers who were building up their Longs there.

EUR/GBP; 30 Minute chart:

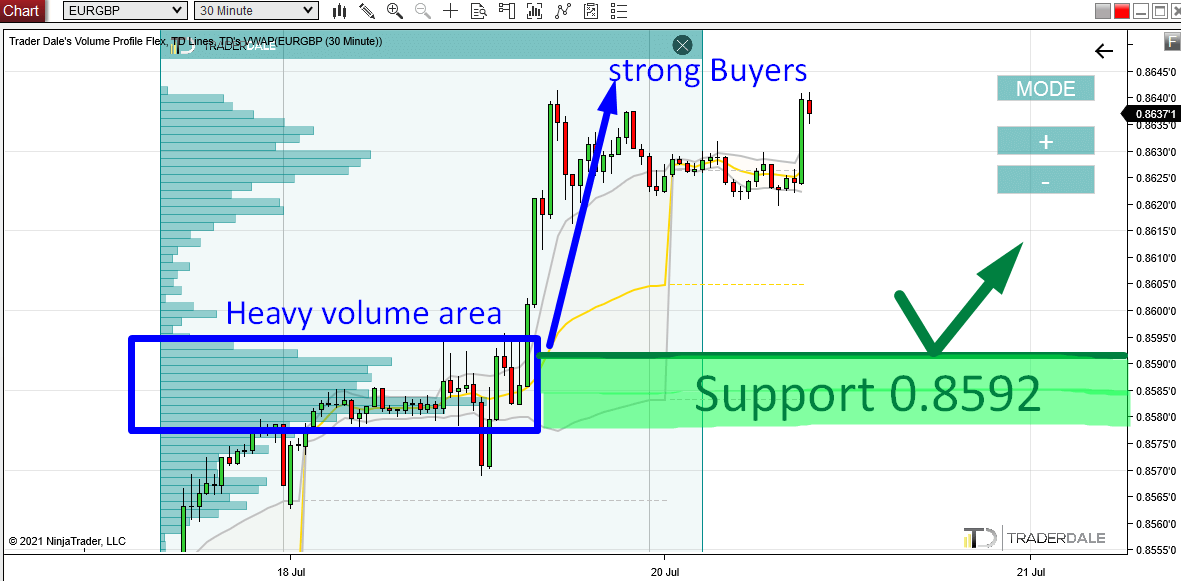
When the price makes it back into this heavy volume area again, then it should work as a strong Support.

The reason being is that the BIG institutions who were building up their Longs there will want to defend this zone. This zone is important for them because they placed a lot of their positions there.

This is why this zone (starting at 0.8592) should work as a strong Support.

This Volume Profile setup I used here is called the “Volume Accumulation Setup“.
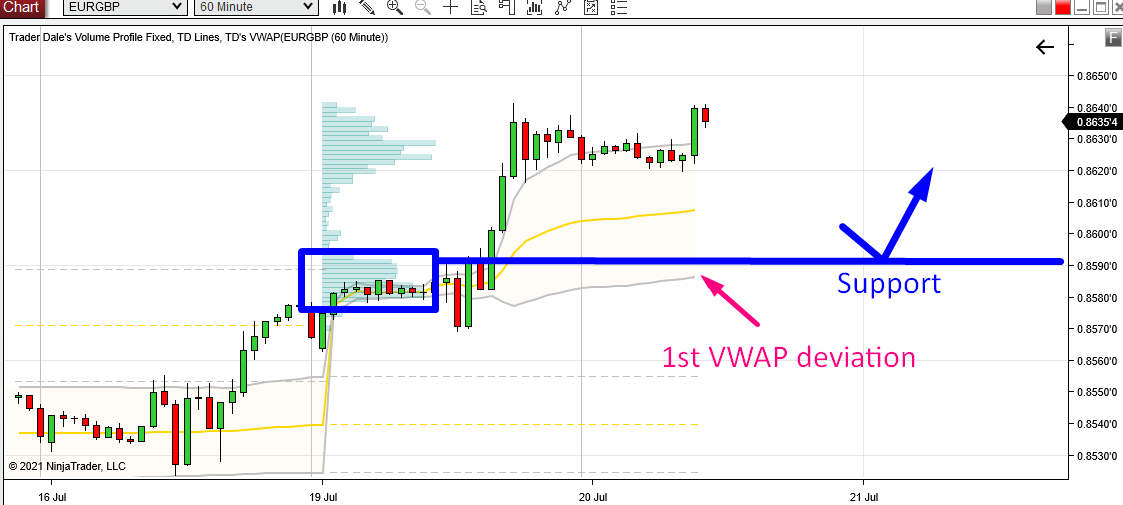
VWAP Setup

What I also like about the zone around 0.8592 is that the 1st VWAP Deviation is very close. It is still developing (moving) but right now it all looks really good!

If it stays somewhere near this area, then there will be another nice confluence – a VWAP setup that I call the “VWAP Rotation Setup“.

This setup basically says that when the price moves in the area between the grey lines (1st Deviations), then it should bounce off them – they work as Supports/Resistances.

EUR/GBP; 60 Minute chart; Weekly VWAP:

If you want to learn more about my VWAP setups then you can watch this recording: WEBINAR: VWAP TRADING STRATEGIES

My Previous Prediction on EUR/GBP

BTW. the last week there was a very similar scenario as today – a Support on EUR/GBP based on the “Volume Accumulation Setup”

This is the original prediction & analysis I made the last week:

EUR/GBP: Volume Profile and Price Action Analysis

This is the PREDICTION → RESULT:

I hope you guys liked today’s analysis! Let me know what you think in the comments below.

Happy trading!

-Dale

Comments

Popular posts from this blog

Recent Trade Breakdown: Combining Price Action & Volume Profile for Smarter Trades

Video Transcript: Hello everyone, it’s Dale here. In this new video series, I want to break down my recent trades. The goal of this series is to show you how I use my Volume Profile trading setups every day in real market conditions, so you can learn from both my wins and my mistakes. If you find this helpful, don’t forget to hit the like and subscribe buttons. Let’s dive in. What you see before you is a screenshot from my session yesterday. It’s taken from the live trading room we held in the  Funded Trader Academy . During that session, a new setup was forming on the  AUD/USD . This is the  AUD/USD  on a 30-minute timeframe, and the new setup was forming right here. There was a resistance level forming around  0.6364 . The reason behind this setup was based on a couple of factors. The main reason was a Volume Profile setup. If you look here at what I’ve highlighted, this area represents a heavy volume zone, which the resistance level was based on. You can see ...

🎯 Top Volume Profile Levels to Trade This Week – 11th November 2024

Do you want ME to help YOU with your trading? Learn my proven Volume Profile & Order Flow trading strategies! Get my proprietary indicators and start making progress. We even set the indicators up for you so you can hit the ground running TODAY! Start Learning to Trade Now! Video Transcript: Hello, everyone! It’s Dale here with a new weekly trading ideas video. What you see before you is the chart from NinjaTrader 8 platform with my custom-made Volume Profile and VWAP indicators. This is the chart of  EUR/USD  on the 30-minute timeframe. I am strongly short-biased on the Euro because I see a strong sell-off as a reaction to the election. This strong sell-off, combined with the fundamentals of the U.S. presidential election, suggests that I should focus more on shorts for this pair. This means I use the Volume Profile over the recent area to look for significant volume zones. If you examine how the volumes were distributed this past Friday, there are two significant volume ...

Bitcoin is Dropping Hard! Here’s Where Smart Money Will Buy Again

Video Transcript: Hello everyone, it’s Dale here. In today’s video, I’d like to talk about Bitcoin. The reason is that Bitcoin has been dropping like crazy, and a lot of traders are wondering where Bitcoin will go and what to expect. If I look at the chart and use Volume Profile, I would say that it’s pretty straightforward because Volume Profile very clearly shows the strongest support and resistance levels. So, let’s take a look at the chart, and let me show you. What you see before you is the daily chart of Bitcoin. This is the big picture, and as you can see, from the all-time high here, Bitcoin experienced quite a significant sell-off and is currently dropping. Right now, I don’t really see any strong support that would stand in the way of this strong sell-off. Let me use Volume Profile and show you what could actually stop the sell-off of Bitcoin. All right, so what I’m going to do is apply Volume Profile over this whole area to see the volume distribution. As you can see, there ...