
EUR/GBP: Volume Profile And Price Action Analysis


Hello guys,

today, I will have a closer look at the EUR/GBP.

What caught my eye at first was a strong selling activity yesterday (that huge red candle you can see in the picture below).

Such a strong and rapid sell-off is a sign of aggressive sellers.

Those sellers were most likely building up their Short positions in the rotation that took place before the sell-off.

You can see those volumes nicely with my Flexible Volume Profile indicator.

EUR/GBP; 30 Minute chart:

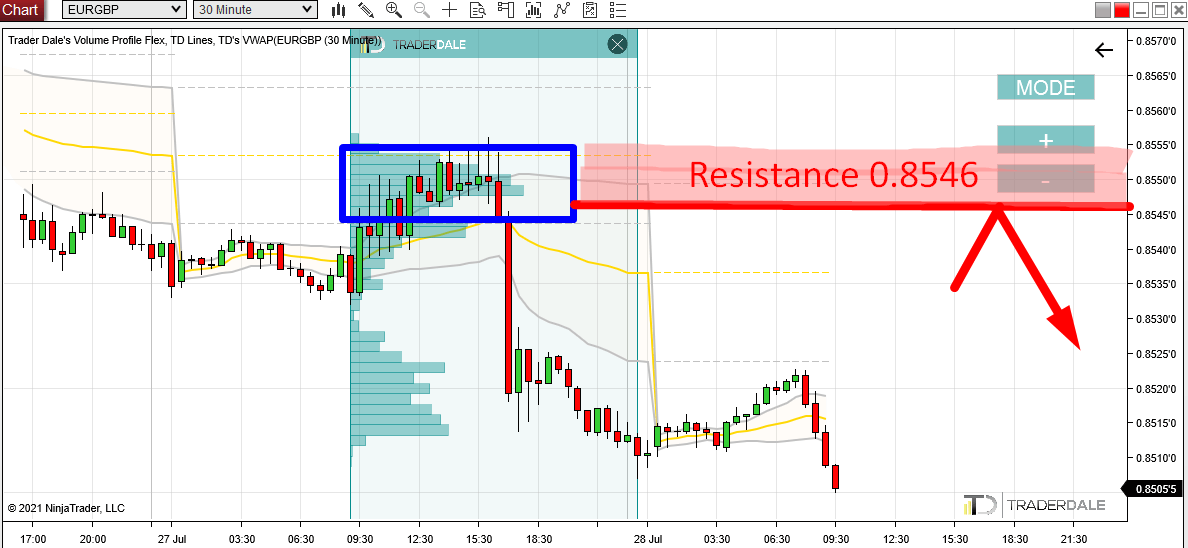
Those heavy volumes that were accumulated before the sell-off are quite important and I think those were the BIG institutional traders getting ready before manipulating the price downwards.

When the price makes a pullback into this area again (starting around 0.8546) then those BIG guys will want to defend this zone and push the price downwards again.

This is what should make this zone a strong Resistance.

A Two-Week POC

Another nice addition to this Resistance is that it is a very significant volume-based level even from the bigger perspective.

This Resistance also represents a place where the heaviest volumes throughout the last two weeks got traded! This means it is a two-week POC (Point Of Control).

You can see that on the picture below, where I merged two weekly Volume Profiles into one two-week Volume Profile.

This is another thing that adds strength to our Resistance around 0.8546.

EUR/GBP; 60 Minute chart; Weekly Volume Profiles:

I hope you guys liked my analysis! Let me know what you think in the comments below!

Happy trading,

-Dale

Comments

  1. Hola, podrías poner tus libros de Kindle en español por favor? Gracias

    ReplyDelete

Post a Comment

Popular posts from this blog

Beginners Guide to Order Flow PART 1: What Is Order Flow?

DEFINITION: Order Flow is an advanced charting software which enables you to read all trading orders that are processed in the market. It helps to track the BIG financial institutions through the trades they make. Most people get confused when they open up a chart with Order Flow for the first time. There is no shame in that. Order Flow shows so many information and it is easy to get overwhelmed and confused if you don’t know what to look for! This Beginners Guide will teach you how to understand how Order Flow works and how you can use it in your trading! In this 1st part of the Order Flow Guide I will show you around the Order Flow interface. Footprints The Order Flow does not show standard candles, but it shows FOOTPRINTS . A footprint shows not only Open, High, Low, Close (as standard candles) but it also shows orders traded in that candle. Orders can be...

5 Character Traits of a Successful Trader – Tips & Tricks of the Pros!

 Maybe you are interested in trading, and you have taken the first step by researching on forex trading. You might also be currently trading but going through a tough time with your results in the markets and dealing with the recurrent autosuggestion, telling you how this journey might not be for you or you are not capable of achieving successes in this journey. It is essential to know that you are not alone in this feeling, and before you fall into the rabbit hole of depression, feeling like a failure in yet another skill you have chosen. Let me make it clear; the answer is YES, anyone can achieve success in trading , including you. It would only cost you a few character trait adjustments. Before we delve in, it is vital to point out that success i...

Quick In & Out Trade on USD/JPY – Smart Money Concepts & Volume Profile

Video Transcript: Hello everyone, it’s Dale here. Welcome to the next video of the new series, where I’ll talk about my recent trades. Today’s trade is on the  USD/JPY . It was a very quick in-and-out trade, so let’s check it out. What you see before you is the 30-minute chart of the  USD/JPY , and the level I was trading from was this short level at  149.63 . The reasoning behind this level—let me zoom in a little so you can see this better—was the volumes that formed here. From this place, there was a sharp sell-off. Even though the volumes do not particularly stand out, what’s important is that from this zone, there was a strong sell-off. There was also a  Fair Value Gap . My software highlights that, but when the gap is filled, it’s not highlighted anymore. If I mark it for you, this was the Fair Value Gap, which is a setup from Smart Money Concepts. I like to trade from the beginning of the Fair Value Gap, which is here. This is also the beginning of a heavy vol...