
Hello guys,
in today’s day trading analysis I will have a closer look at the CAD/JPY.
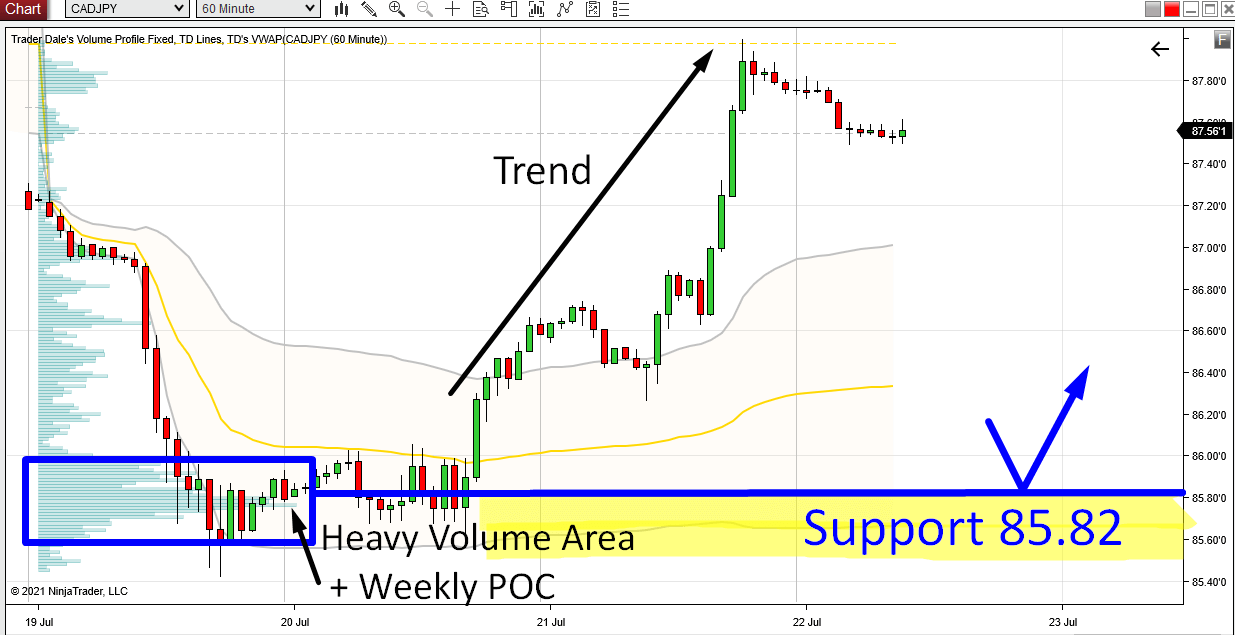
What initially caught my eye there was a newly formed uptrend – a strong buying activity yesterday.
Then I checked the Volume Profile and I saw that this strong trend activity started from the Weekly POC (Point Of Control). BINGO!
Let me now elaborate a bit…
A Weekly POC is a place where the heaviest volumes were accumulated throughout the whole week. It is very often the most important place in the chart – at least if you are a day trader.
Big trading institutions are slowly building up their huge trading positions in places like this. The massive volumes we see there are most likely theirs (a big part of it is theirs to be precise).
After they have accumulated their positions, they manipulated the price to go into a trend. Like in here.
There is an uptrend, and that means that the BIG guys were entering Longs!
CAD/JPY; 60 Minute chart:
Wait For A Pullback
When there is a pullback to this zone again, those BIG guys will want to defend it. This zone (starting at 85.82) is important for them because they placed a lot of their trades there.
They will want to push the price upwards from there again. And this is what makes it a strong Support!
That’s why I am always interested in Weekly POC from which a strong trend starts.
I call this Volume Profile setup the “Volume Accumulation Setup“
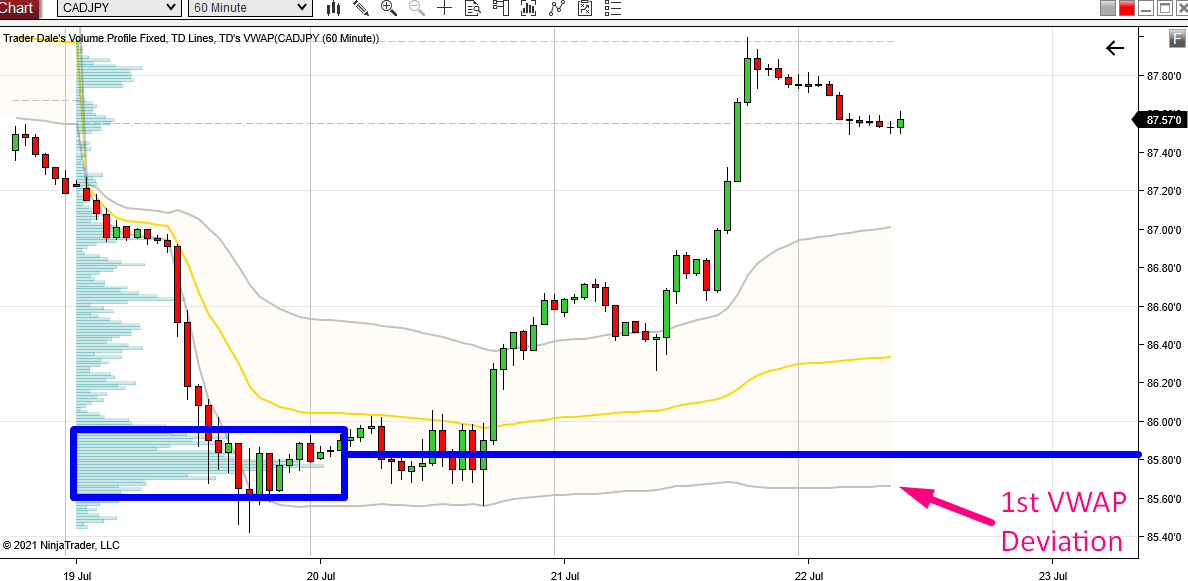
VWAP Setup
A nice little addition to our Support is the 1st VWAP Deviation.
It is currently very close to our Support and if it stays in this area when the price makes a pullback there, then we will have a very nice trade confirmation!
This VWAP setup is called the “VWAP Rotation Setup“
CAD/JPY; 60 Minute chart:
If you would like to learn more about VWAP and how to use it in your trading, then watch this free webinar recording:
I hope you guys liked my analysis! Let me know what you think in the comments below!
Happy trading,
-Dale
- Get link
- X
- Other Apps
- Get link
- X
- Other Apps
Comments
Post a Comment