
AUD/JPY: Trading In A Trend – Volume Profile Analysis


Hello guys,

today’s day trading analysis will be on the AUD/JPY.

There was a pretty strong downtrend a couple of days ago on the AUD/JPY. This is something I am always interested about because a trend usually means that the big guys (big trading institutions) are moving and manipulating the market.

I am always interested the most in how the volumes were distributed within the trend, because volumes = the BIG guys.

What I do is I use my Flexible Volume Profile to look into the trend and I look for significant Volume Clusters.

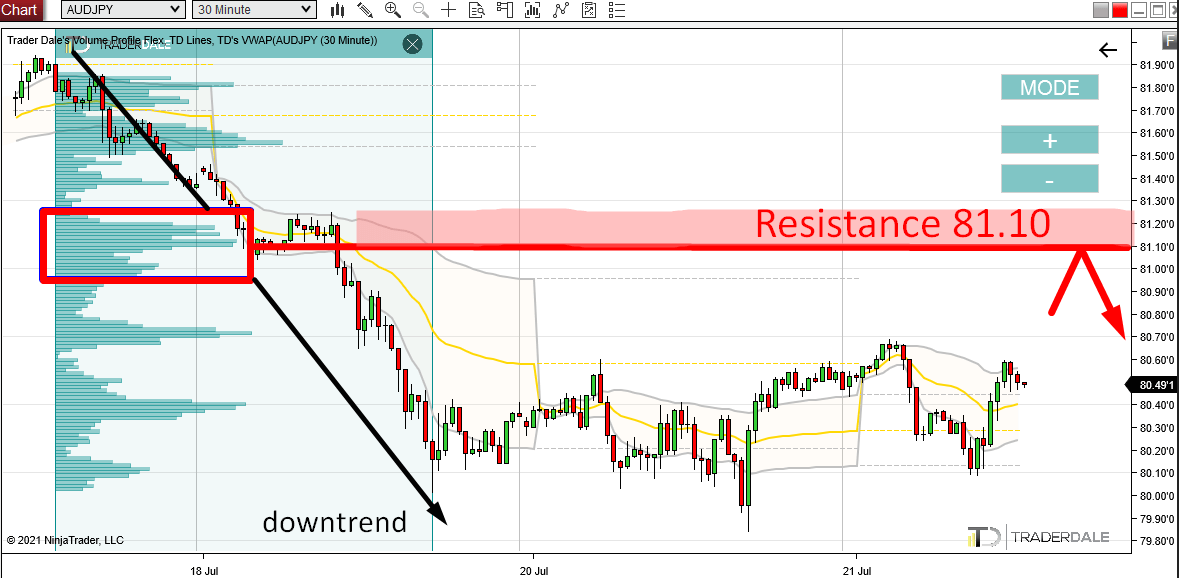
Look for Volume Clusters

Volume Clusters are the little bumps on the profile. They show where heavy volumes were traded – and thus the activity of the BIG guys.

Right now, there is a significant Volume Cluster around 81.10.

I think that the BIG institutions who were driving this downtrend were adding to their Short positions there.

This zone is now important for them, because they placed their trades there.

This is an important information because when the price makes it back into this zone again, those BIG guys will want to defend this zone.

Defend = manipulate the price downwards from there again. And that’s what makes this a strong Resistance.

This setup is called the “Volume Profile – TREND SETUP

AUD/JPY; 30 Minute chart:

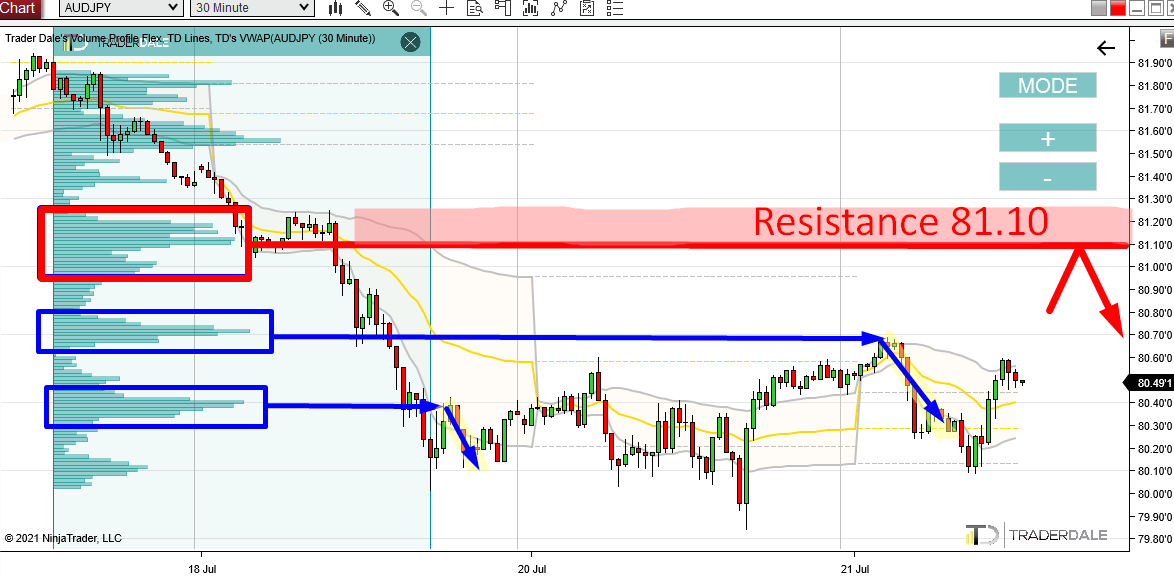
Already “Tested” Volume Clusters

As you have probably noticed, the Volume Cluster around 81.10 is not the only one there.

There are also two significant Volume Clusters below it.

The difference between the 81.10 and the two Volume Clusters below is that the lower Volume Clusters got already “tested”.

The price has already made a pullback to them and there were already reactions.

For this reason, I consider those Volume Clusters “spent”.

The closest significant Volume Cluster that hasn’t been tested yet is the one around 81.10

AUD/JPY; 30 Minute chart:

I hope you guys liked my analysis! Let me know what you think in the comments below!

Happy trading,

-Dale

Comments

Popular posts from this blog

How to Track The Institutions With Volume Profile – Weekly Trading Ideas 6.4.2020

*Disclaimer: Presented opinions, trades and trading ideas on the markets and charts is not advice nor a trading recommendation. It is general information and it is for educational purposes only. **You can learn more about my trading setups in my new book: VOLUME PROFILE: The insider’s guide to trading If you would like to learn to trade with Volume Profile and to trade with me every day, then join my Trading Course!

Recent Trade Breakdown: Combining Price Action & Volume Profile for Smarter Trades

Video Transcript: Hello everyone, it’s Dale here. In this new video series, I want to break down my recent trades. The goal of this series is to show you how I use my Volume Profile trading setups every day in real market conditions, so you can learn from both my wins and my mistakes. If you find this helpful, don’t forget to hit the like and subscribe buttons. Let’s dive in. What you see before you is a screenshot from my session yesterday. It’s taken from the live trading room we held in the  Funded Trader Academy . During that session, a new setup was forming on the  AUD/USD . This is the  AUD/USD  on a 30-minute timeframe, and the new setup was forming right here. There was a resistance level forming around  0.6364 . The reason behind this setup was based on a couple of factors. The main reason was a Volume Profile setup. If you look here at what I’ve highlighted, this area represents a heavy volume zone, which the resistance level was based on. You can see ...

ORDER FLOW: How to Trade the Absorption Setup (Trade Entry Confirmation)

Video Transcript: Hello everyone, and in this video, I’d like to talk about order flow and one of my favorite confirmation setups in order flow. The confirmation setup is called the absorption, and I’ll show you an example of a trade I made a couple of days ago. I think this is the perfect example of how you can use the absorption setup to confirm your trade entry. So, let’s take a look at it. First, let me start by showing you the level I wanted to trade, and then I’ll show you the absorption setup. You’re looking at the  EUR/USD  30-minute chart, and I had a long level here, marked by this line. This was a long level based on a Volume Profile setup, focusing on those heavy volumes formed within this important rejection. So, this was the long level. What happened was that the price started to go into a sudden sell-off, and there wasn’t really any strong macro news behind this. I wasn’t really sure what was going on, but there was this sudden sell-off, this spike move. Because...