
Hello guys,
a nice day trading opportunity has formed recently on the EUR/USD. Let’s check it out!
Currently, the EUR/USD shot upwards aggressively. That’s a sign of strong and aggressive Buyers pushing the price up.
I think those Buyers were entering their Long trades in the tight rotation that formed in the early European session today.
Volume Profile Analysis
If you use my Volume Profile indicator, you can nicely see those heavy volumes that got accumulated there.
To me, it seems that Buyers were building up their Longs there and then they pushed the price upwards.
Now we know where strong institutional Buyers were active and which place is important for them. It’s the rotation because they were entering their Longs there.
When there is a pullback at some point in the future, then I expect this area around 1.2230 will work as a strong Support.
Why? Because this area is important for the Buyers who placed a lot of their Longs there.
This Volume Profile setup is called the “Volume Accumulation Setup“
EUR/USD; 30 Minute chart:


Price Action Setup
The Volume Profile setup is not all that I like about this though.
If you look at the chart below, then you can see that this Support was a Resistance in the past. The price very nicely bounced off it (by the way, we were trading this with members of my Trading Course yesterday, and got a nice and quick profit there).
When this Resistance got breached earlier today, it then became a Support. This is a Price Action setup I like to use as an addition to my Volume Profile setups.
You can learn more about this setup here:
Price Action Setup: Breached Resistance Becomes A Support
EUR/USD; 30 Minute chart:

VWAP Setup
As an addition to the two setups (Volume Profile and Price Action setups), there is also a third confirmation – a third setup.
This one is based on VWAP.
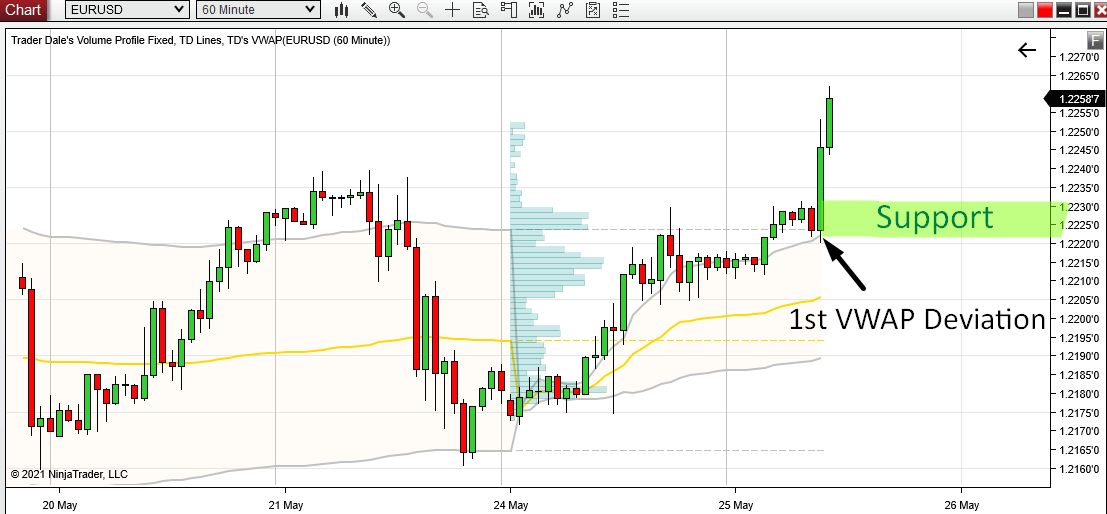
Currently, the price is moving above the 1st VWAP Deviation (that’s the grey line). When it gets back, then it should bounce off it. That means this grey line is supposed to work as a Support.
This is a very simple VWAP setup I like to trade when there is a trend.
If you are interesting in VWAP setups like this one, then you may want to check out this webinar recording:
EUR/USD; 30Minute chart:
All in all, there are three setups that point to a strong Support (1.2230) on the EUR/USD:
I always try to find setup confluences like these. The more the better!
I hope you guys liked today’s analysis. Let me know what you think in the comments below!
Happy trading,
-Dale
P.S. There is currently a special “Memorial Day Sale” and you can get -50% discount on my best educational package called the ELITE PACK.
You can get it here: ELITE PACK 50% discounted
The Sale will end 31st May 2021
More info about the ELITE PACK here:
- Get link
- X
- Other Apps
- Get link
- X
- Other Apps
Comments
Post a Comment