
AUD/JPY: Day Trading Analysis With Volume Profile And Price Action


Hello guys,

in today’s intraday trading analysis I will focus on AUD/JPY.

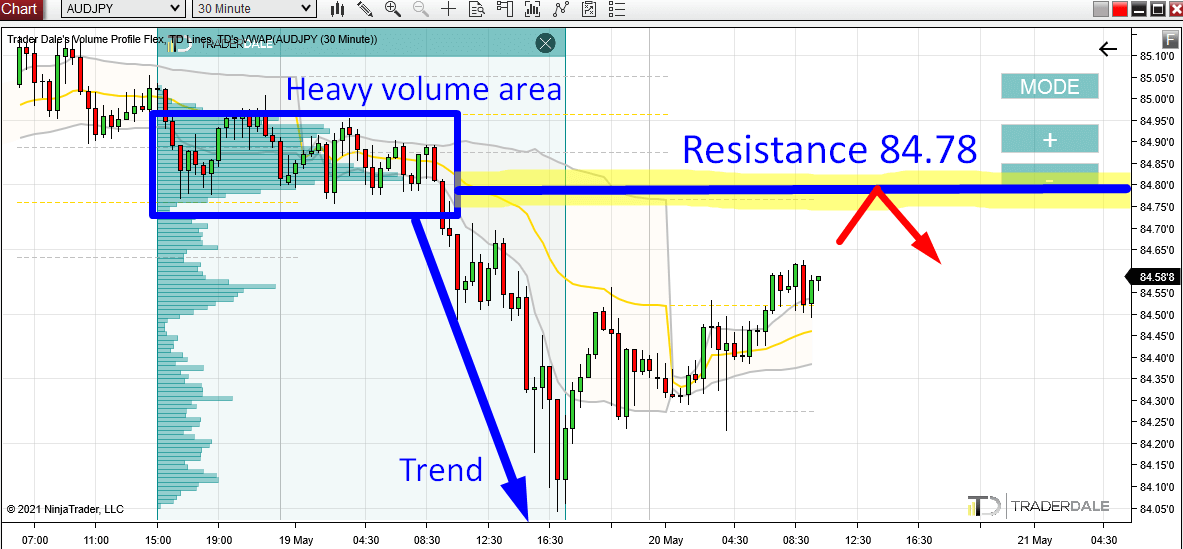
There was a trend day yesterday and the AUD/JPY went down. Now there seems there may be a correction and the price is heading towards a pretty significant Resistance level. So let me talk about that.

Before the strong selling yesterday, there was a rotation. In that rotation heavy volumes got traded. You can see it if you use my Flexible Volume Profile.

I think that in this volume area strong Sellers were building up their Short positions. Then they pushed the price aggressively downwards.

This tells us that this zone (around 84.78) should be important for strong institutional Sellers. That’s why I think that if there is a pullback to this zone again, it will work as a Resistance.

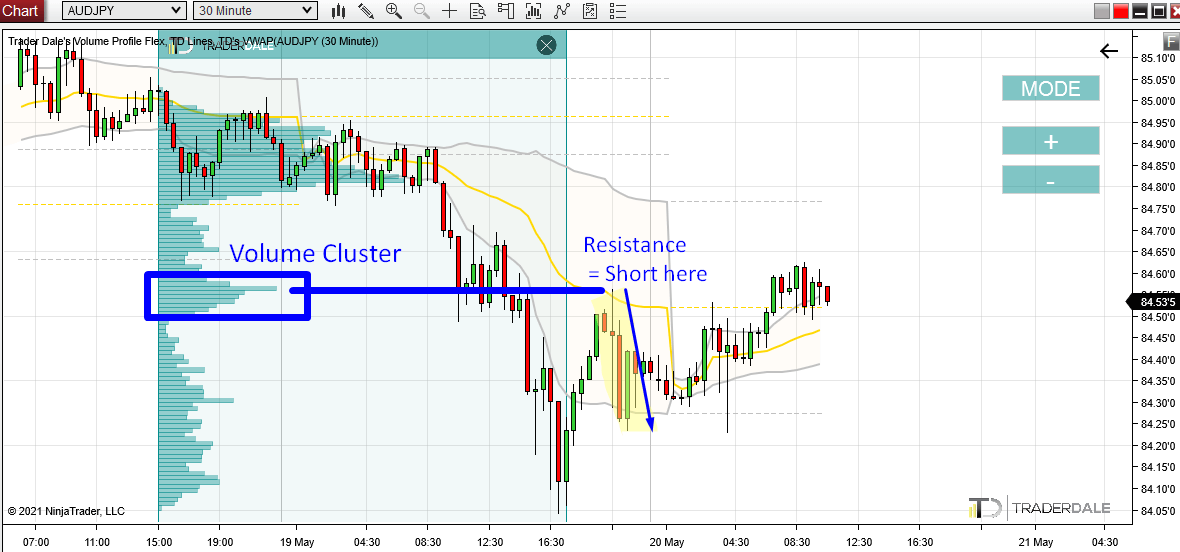
This Volume Profile setup I used is called the “Volume Accumulation Setup“.

AUD/JPY; 30-minute chart:

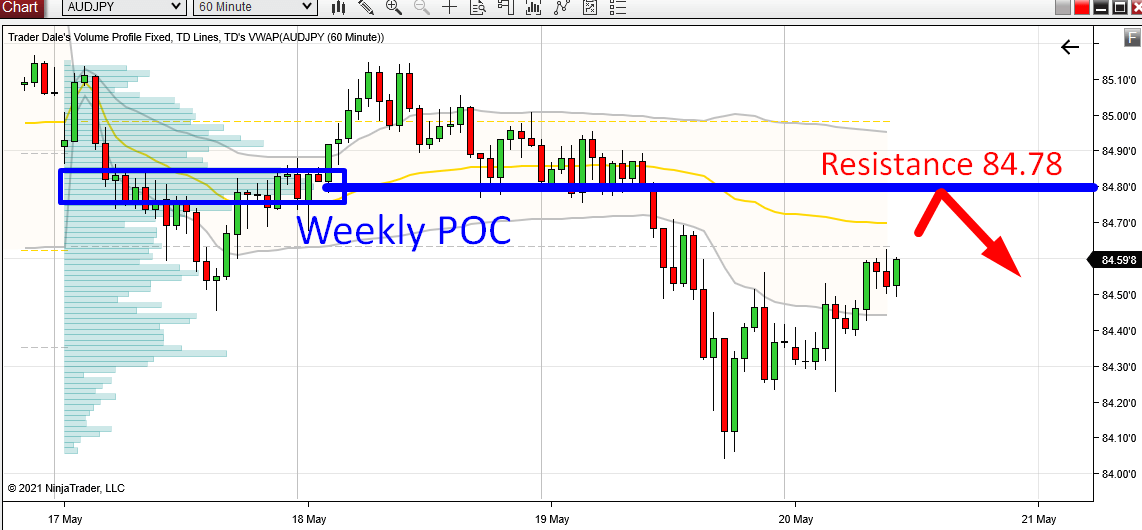
Weekly Point Of Control

What adds strength to this Resistance around 84.78 is that it is also the Point Of Control (POC) of this week. This means that the heaviest volumes throughout this week were traded at this specific price level. This definitely adds significance to this level and it’s a nice confluence to have there.

AUD/JPY; 60 Minute chart; Weekly Volume Profile:

Support Becoming Resistance (Price Action Setup)

Another nice addition to add strength to our Resistance is a simple Price Action setup called “Support → Resistance“.

As you can see from the picture below, our Resistance at 84.78 worked as a strong Support in the past. The price bounced off it several times.

This Support is now breached. When it got breached and the price started to move below it, then it became a Resistance.

That’s what this Price Action setup is all about – a Support that got breached becomes a Resistance.

Check it out on the picture below:

The thing I like here is that all those three signals line up nicely together and they all point to our 84.78 Resistance.

I hope you guys liked this day trading analysis! Let me know your thoughts in the comments below!

Happy trading,

-Dale

Do you want ME to help YOU with your trading?

Join one of my Volume Profile Educational courses and get my private trading levels, 15 hours of video content, my custom made Volume Profile indicators, and more!

P.S. If you are with my for some time, maybe you have noticed one more nice setup that played out recently on AUD/JPY. It was a trade based on the Volume Profile Trend Setup. Here it is:

Comments

Popular posts from this blog

How to Track The Institutions With Volume Profile – Weekly Trading Ideas 6.4.2020

*Disclaimer: Presented opinions, trades and trading ideas on the markets and charts is not advice nor a trading recommendation. It is general information and it is for educational purposes only. **You can learn more about my trading setups in my new book: VOLUME PROFILE: The insider’s guide to trading If you would like to learn to trade with Volume Profile and to trade with me every day, then join my Trading Course!

Bitcoin is Dropping Hard! Here’s Where Smart Money Will Buy Again

Video Transcript: Hello everyone, it’s Dale here. In today’s video, I’d like to talk about Bitcoin. The reason is that Bitcoin has been dropping like crazy, and a lot of traders are wondering where Bitcoin will go and what to expect. If I look at the chart and use Volume Profile, I would say that it’s pretty straightforward because Volume Profile very clearly shows the strongest support and resistance levels. So, let’s take a look at the chart, and let me show you. What you see before you is the daily chart of Bitcoin. This is the big picture, and as you can see, from the all-time high here, Bitcoin experienced quite a significant sell-off and is currently dropping. Right now, I don’t really see any strong support that would stand in the way of this strong sell-off. Let me use Volume Profile and show you what could actually stop the sell-off of Bitcoin. All right, so what I’m going to do is apply Volume Profile over this whole area to see the volume distribution. As you can see, there ...

Recent Trade Breakdown: Combining Price Action & Volume Profile for Smarter Trades

Video Transcript: Hello everyone, it’s Dale here. In this new video series, I want to break down my recent trades. The goal of this series is to show you how I use my Volume Profile trading setups every day in real market conditions, so you can learn from both my wins and my mistakes. If you find this helpful, don’t forget to hit the like and subscribe buttons. Let’s dive in. What you see before you is a screenshot from my session yesterday. It’s taken from the live trading room we held in the  Funded Trader Academy . During that session, a new setup was forming on the  AUD/USD . This is the  AUD/USD  on a 30-minute timeframe, and the new setup was forming right here. There was a resistance level forming around  0.6364 . The reason behind this setup was based on a couple of factors. The main reason was a Volume Profile setup. If you look here at what I’ve highlighted, this area represents a heavy volume zone, which the resistance level was based on. You can see ...