
CHF/JPY: Volume Profile And Price Action Analysis


Trader Dale - Free Book

Hello guys,

in today’s day trading analysis I will focus on the current uptrend on the CHF/JPY.

When there is an uptrend, then I don’t fancy chasing the market, and entering longs when the price is at the highs of the trend.

What I prefer is wait for pullbacks. I wait until the price retraces down a bit, and then I enter my Longs.

Look For Volume Clusters

Retraces to where? To places with significant volumes. I call those Volume Clusters.

Whenever there is an uptrend I use my Flexible Volume Profile to see how the volumes were distributed inside that uptrend.

Exactly like in this case.

CHF/JPY; 30 Minute chart:

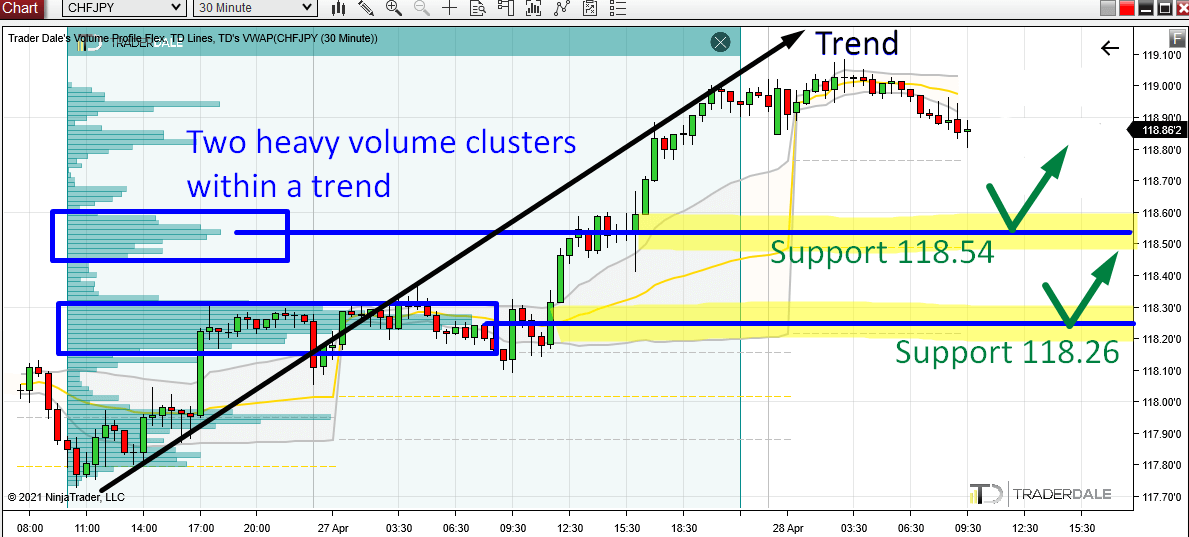
When you use the Volume Profile like this, then it will nicely reveal those Volume Clusters – areas where institutional buying activity took place.

On the CHF/JPY there are two areas that stand out and that I like. The first one is a Volume Cluster around 118.54, and the second one is a Volume Cluster around 118.26.

In both those places heavy volumes got traded. Most likely, it was big trading institutions entering more Longs and getting ready for another push upwards.

Those are places I think the Buyers will defend and that will work as Supports.

This is one of my favorite setups and you can learn more about it here: Volume Profile: Trend Setup

Do you want ME to help YOU with your trading?

Join one of my Volume Profile Educational courses and get my private trading levels, 15 hours of video content, my custom made Volume Profile indicators, and more!

Price Action Setup as an Additional Confluence

But let’s not stop just there! There is more to those two areas I showed you. A very nice confluence with a Price Action setup!

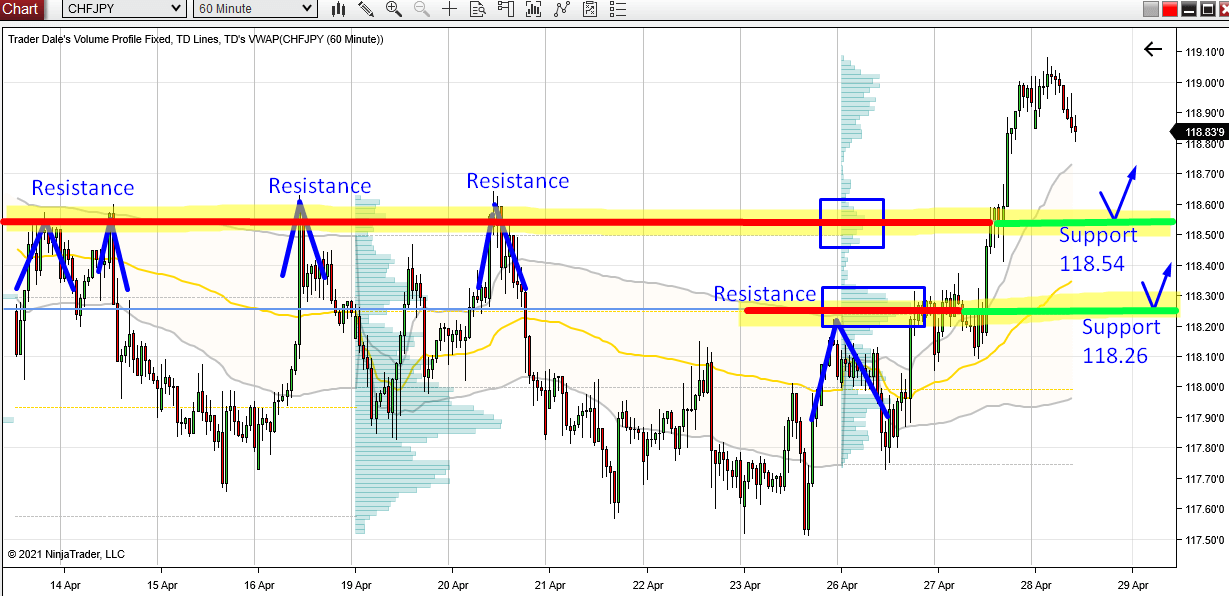
Both those levels – 118.54 and 118.26 worked as Resistances in the past.

The price reacted four times to the zone around 118.54, and once to  118.26. This tells us that those areas already worked as Resistances in the past. You can see that in the picture below.

When a Resistance gets breached, it then becomes a Support. This is an old and simple Price Action setup I like to use and combine with my Volume Profile setups. Just like I did it here.

CHF/JPY; 60 Minute chart:

If you would like to learn more about this setup, then you can do so here:

Price Action Setup: Resistance Becoming a Support

I hope you guys liked today’s analysis. Let me know what you think in the comments below!

Happy trading,

-Dale

Comments

Popular posts from this blog

Bitcoin is Dropping Hard! Here’s Where Smart Money Will Buy Again

Video Transcript: Hello everyone, it’s Dale here. In today’s video, I’d like to talk about Bitcoin. The reason is that Bitcoin has been dropping like crazy, and a lot of traders are wondering where Bitcoin will go and what to expect. If I look at the chart and use Volume Profile, I would say that it’s pretty straightforward because Volume Profile very clearly shows the strongest support and resistance levels. So, let’s take a look at the chart, and let me show you. What you see before you is the daily chart of Bitcoin. This is the big picture, and as you can see, from the all-time high here, Bitcoin experienced quite a significant sell-off and is currently dropping. Right now, I don’t really see any strong support that would stand in the way of this strong sell-off. Let me use Volume Profile and show you what could actually stop the sell-off of Bitcoin. All right, so what I’m going to do is apply Volume Profile over this whole area to see the volume distribution. As you can see, there ...

Quick In & Out Trade on USD/JPY – Smart Money Concepts & Volume Profile

Video Transcript: Hello everyone, it’s Dale here. Welcome to the next video of the new series, where I’ll talk about my recent trades. Today’s trade is on the  USD/JPY . It was a very quick in-and-out trade, so let’s check it out. What you see before you is the 30-minute chart of the  USD/JPY , and the level I was trading from was this short level at  149.63 . The reasoning behind this level—let me zoom in a little so you can see this better—was the volumes that formed here. From this place, there was a sharp sell-off. Even though the volumes do not particularly stand out, what’s important is that from this zone, there was a strong sell-off. There was also a  Fair Value Gap . My software highlights that, but when the gap is filled, it’s not highlighted anymore. If I mark it for you, this was the Fair Value Gap, which is a setup from Smart Money Concepts. I like to trade from the beginning of the Fair Value Gap, which is here. This is also the beginning of a heavy vol...

Recent Trade Breakdown: Combining Price Action & Volume Profile for Smarter Trades

Video Transcript: Hello everyone, it’s Dale here. In this new video series, I want to break down my recent trades. The goal of this series is to show you how I use my Volume Profile trading setups every day in real market conditions, so you can learn from both my wins and my mistakes. If you find this helpful, don’t forget to hit the like and subscribe buttons. Let’s dive in. What you see before you is a screenshot from my session yesterday. It’s taken from the live trading room we held in the  Funded Trader Academy . During that session, a new setup was forming on the  AUD/USD . This is the  AUD/USD  on a 30-minute timeframe, and the new setup was forming right here. There was a resistance level forming around  0.6364 . The reason behind this setup was based on a couple of factors. The main reason was a Volume Profile setup. If you look here at what I’ve highlighted, this area represents a heavy volume zone, which the resistance level was based on. You can see ...