
CAD/JPY: Volume Profile And Price Action Analysis


Trader Dale - Free Book

Hello guys,

today’s analysis will be about a new day trading Support that has formed recently on CAD/JPY.

This one struck me at first sight, to be honest. It’s easily visible and hard to miss.

Price Action Analysis

The first two things to notice here is a very long rotation on CAD/JPY. It lasted almost three full days. Then, from this rotation, a strong uptrend started.

This is the thing that struck me at first sight. Why? Because this is the first step to my Volume Accumulation Setup – a Rotation followed by a trend. Ideally, a long rotation followed by a strong trend. Like in here.

The next step is to look at volumes.

Usually, when there is a rotation heavy volumes get traded there. You can see that when you use my Volume Profile tool.

CAD/JPY; 30 Minute chart:

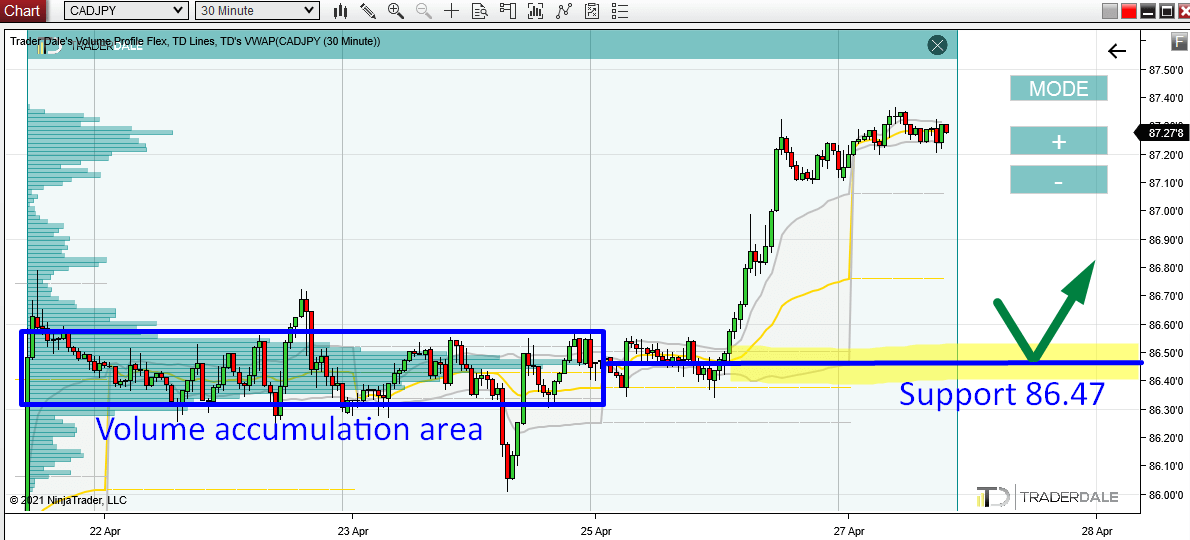
As you can see in the picture above, there were massive volumes traded in this rotation. This is where strong institutional Buyers were accumulating their Long positions. Slowly, and unnoticed. Then they pushed the price upwards aggressively (using Market Orders).

The heaviest volumes got accumulated at 86.47. This is where the Volume Profile is the thickest.

When the price comes back into this area at some point in the future, then I expect the strong Buyers who placed their Longs there to push the price upwards again. They will want to defend this zone because it is important for them. They placed a lot of their Long orders there before.

Do you want ME to help YOU with your trading?

Join one of my Volume Profile Educational courses and get my private trading levels, 15 hours of video content, my custom made Volume Profile indicators, and more!

Two-Week Point Of Control (POC)

A really nice addition is that our Support at 86.47 is also a Point Of Control (POC) of the last two weeks! This means that the heaviest volumes in the last two weeks got traded there.

This is sort of a “confirmation on the bigger picture“. Bigger picture why? Because we used Weekly Volume Profile, and also bit higher time frame (60 Minute).

CAD/JPY; 60 Minute chart:

I hope you guys liked today’s analysis! Let me know what you think in the comments below!

Happy trading,

-Dale

Comments

Popular posts from this blog

Recent Trade Breakdown: Combining Price Action & Volume Profile for Smarter Trades

Video Transcript: Hello everyone, it’s Dale here. In this new video series, I want to break down my recent trades. The goal of this series is to show you how I use my Volume Profile trading setups every day in real market conditions, so you can learn from both my wins and my mistakes. If you find this helpful, don’t forget to hit the like and subscribe buttons. Let’s dive in. What you see before you is a screenshot from my session yesterday. It’s taken from the live trading room we held in the  Funded Trader Academy . During that session, a new setup was forming on the  AUD/USD . This is the  AUD/USD  on a 30-minute timeframe, and the new setup was forming right here. There was a resistance level forming around  0.6364 . The reason behind this setup was based on a couple of factors. The main reason was a Volume Profile setup. If you look here at what I’ve highlighted, this area represents a heavy volume zone, which the resistance level was based on. You can see ...

Bitcoin is Dropping Hard! Here’s Where Smart Money Will Buy Again

Video Transcript: Hello everyone, it’s Dale here. In today’s video, I’d like to talk about Bitcoin. The reason is that Bitcoin has been dropping like crazy, and a lot of traders are wondering where Bitcoin will go and what to expect. If I look at the chart and use Volume Profile, I would say that it’s pretty straightforward because Volume Profile very clearly shows the strongest support and resistance levels. So, let’s take a look at the chart, and let me show you. What you see before you is the daily chart of Bitcoin. This is the big picture, and as you can see, from the all-time high here, Bitcoin experienced quite a significant sell-off and is currently dropping. Right now, I don’t really see any strong support that would stand in the way of this strong sell-off. Let me use Volume Profile and show you what could actually stop the sell-off of Bitcoin. All right, so what I’m going to do is apply Volume Profile over this whole area to see the volume distribution. As you can see, there ...

ORDER FLOW: How to Trade the Absorption Setup (Trade Entry Confirmation)

Video Transcript: Hello everyone, and in this video, I’d like to talk about order flow and one of my favorite confirmation setups in order flow. The confirmation setup is called the absorption, and I’ll show you an example of a trade I made a couple of days ago. I think this is the perfect example of how you can use the absorption setup to confirm your trade entry. So, let’s take a look at it. First, let me start by showing you the level I wanted to trade, and then I’ll show you the absorption setup. You’re looking at the  EUR/USD  30-minute chart, and I had a long level here, marked by this line. This was a long level based on a Volume Profile setup, focusing on those heavy volumes formed within this important rejection. So, this was the long level. What happened was that the price started to go into a sudden sell-off, and there wasn’t really any strong macro news behind this. I wasn’t really sure what was going on, but there was this sudden sell-off, this spike move. Because...