
AUD/CAD: Volume Profile and Price Action Day Trading Analysis


Trader Dale - Free Book

Hello guys,

in today’s day trading analysis I am going to focus on AUD/CAD.

The reason being is a nice “Volume Accumulation Setup” that I spotted there, on a 30 Minute chart.

Volume Profile Setup

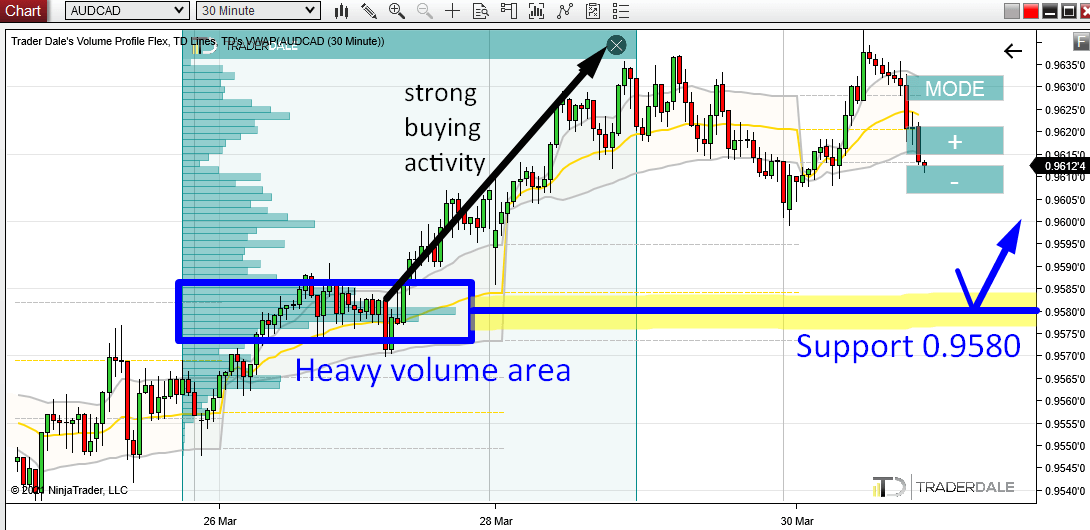
On Friday, there was a rotation, from which an uptrend started (=strong buying activity).

This is a typical scenario the Volume Accumulation Setup is based on: First, a rotation and then a strong trend development – that’s what you want to see!

This tells us one thing – strong Buyers were building up their Long positions in that rotation. Slowly, unnoticed. When they have accumulated their positions, they started to push the price upwards aggressively.

How do we tell that there were heavy volumes accumulated in that rotation? By using the Volume Profile indicator!

AUD/CAD; 30 Minute chart:

This is a piece of information we can work with!

When the price makes it back into this heavy volume area we can expect those Buyers to defend this zone. It is important for them because they placed a lot of their Longs there. They won’t let the price shoot past this area without a fight!

This is the reason, why I think this zone around 0.9580 will work as a strong Support in the future. Now we just need to wait until the price reaches it.

Price Action Setup

As you probably know, I like to combine trading setups. The more trading setups point to a a trading level, the better.

In this case, there is a Price Action trading setup that nicely confirms our 0.9580 Support.

The thing is, that this 0.9580 Support zone worked as a Resistance in the past. You can tell because the price bounced away from this zone strongly before (on Thursday).

Then, on Friday this Resistance got breached.

When a Resistance gets breached, it then becomes a Support. This is an old Price Action setup I like to use.

I would not trade this as a standalone setup. However, the cool thing about this is that in this case, the newly formed Support nicely aligns with the Support we found using Volume Profile. That Support around 0.9580.

See? Nice combo of two trading setups. One is based on Volume Profile, the other on Price ActionTwo independent setups point to the same Support.

AUD/CAD; 30 Minute chart:

It’s the combo of the two trading setups that makes this support strong!

I hope you guys liked today’s analysis. Let me know what you think in the comments below!

Happy trading,

-Dale

Do you want ME to help YOU with your trading?

Join one of my Volume Profile Educational courses and get my private trading levels, 15 hours of video content, my custom made Volume Profile indicators, and more!

Comments

Popular posts from this blog

How to Track The Institutions With Volume Profile – Weekly Trading Ideas 6.4.2020

*Disclaimer: Presented opinions, trades and trading ideas on the markets and charts is not advice nor a trading recommendation. It is general information and it is for educational purposes only. **You can learn more about my trading setups in my new book: VOLUME PROFILE: The insider’s guide to trading If you would like to learn to trade with Volume Profile and to trade with me every day, then join my Trading Course!

Recent Trade Breakdown: Combining Price Action & Volume Profile for Smarter Trades

Video Transcript: Hello everyone, it’s Dale here. In this new video series, I want to break down my recent trades. The goal of this series is to show you how I use my Volume Profile trading setups every day in real market conditions, so you can learn from both my wins and my mistakes. If you find this helpful, don’t forget to hit the like and subscribe buttons. Let’s dive in. What you see before you is a screenshot from my session yesterday. It’s taken from the live trading room we held in the  Funded Trader Academy . During that session, a new setup was forming on the  AUD/USD . This is the  AUD/USD  on a 30-minute timeframe, and the new setup was forming right here. There was a resistance level forming around  0.6364 . The reason behind this setup was based on a couple of factors. The main reason was a Volume Profile setup. If you look here at what I’ve highlighted, this area represents a heavy volume zone, which the resistance level was based on. You can see ...

ORDER FLOW: How to Trade the Absorption Setup (Trade Entry Confirmation)

Video Transcript: Hello everyone, and in this video, I’d like to talk about order flow and one of my favorite confirmation setups in order flow. The confirmation setup is called the absorption, and I’ll show you an example of a trade I made a couple of days ago. I think this is the perfect example of how you can use the absorption setup to confirm your trade entry. So, let’s take a look at it. First, let me start by showing you the level I wanted to trade, and then I’ll show you the absorption setup. You’re looking at the  EUR/USD  30-minute chart, and I had a long level here, marked by this line. This was a long level based on a Volume Profile setup, focusing on those heavy volumes formed within this important rejection. So, this was the long level. What happened was that the price started to go into a sudden sell-off, and there wasn’t really any strong macro news behind this. I wasn’t really sure what was going on, but there was this sudden sell-off, this spike move. Because...