
AUD/CAD: Volume Profile and Price Action Analysis

Trader Dale - Free Book

Hello guys,

today’s focus will be on day trading analysis of AUD/CAD.

There was a trend development on many Forex pairs yesterday. AUD/CAD was not an exception.

A trend day usually creates many trading opportunities, like in here.

Volume Profile Analysis

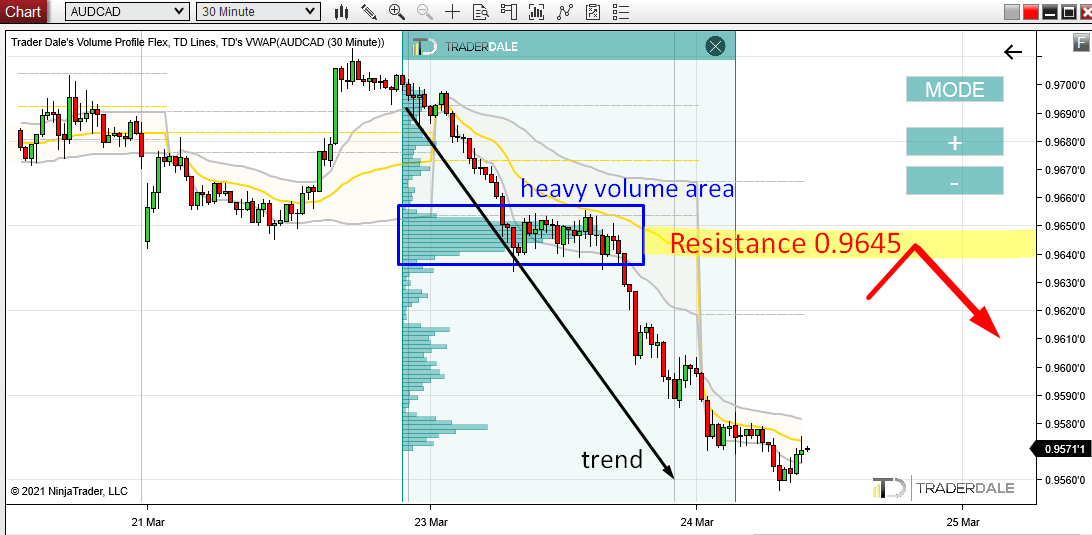
If you use my Flexible Volume Profile on the downtrend that formed yesterday then you will see that there is one really significant area.

This area is around 0.9645 and it is significant because heavy volumes got traded there – you can tell because Volume Profile is really wide there.

What does this mean when you see it in a downtrend?

It means that strong Sellers were adding to their Shorts massively there. Then they pushed the price downwards some more.

When there is a pullback into this area at some point in the future those Sellers are likely to defend this place. They placed a lot of their Shorts there and this place is important for them.

This is why it should work as a Resistance and the price should bounce off this place.

This is one of my favorite Volume Profile setups and it is called the “Trend Setup“.

AUD/CAD; 30 Minute time frame:

Price Action Analysis

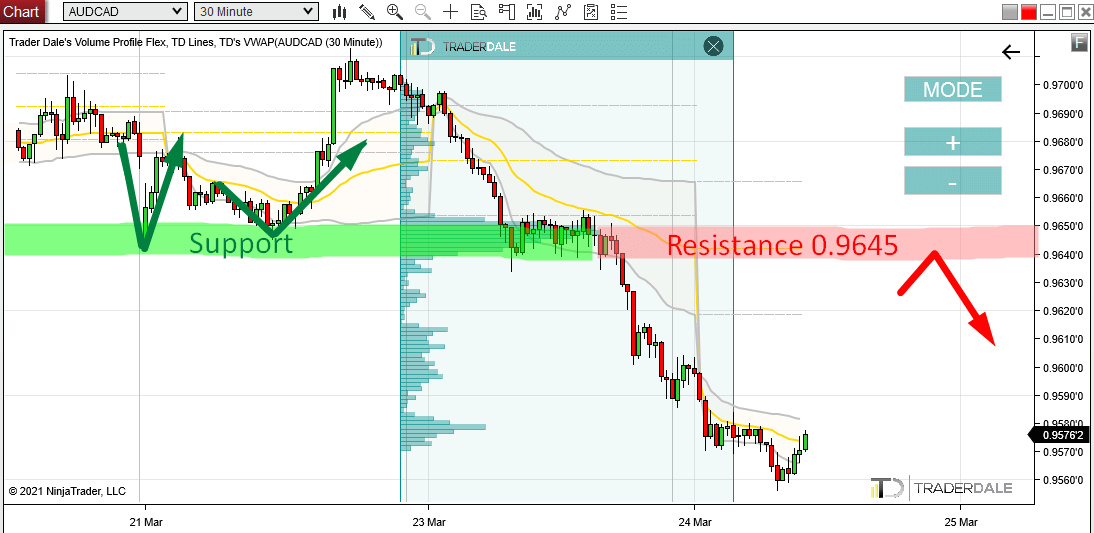
I really like to combine the Trend Setup with Price Action Setup called “Support →Resistance“.

It is my favorite two-setup combo. It goes like this:

First, you identify the Trend Setup – that significant volume cluster created within a trend.

Then, you want to see that the price has already reacted to this zone in the past. Like in the picture below.

The price bounced upwards off this zone twice on Monday. This means it was a Support. When the price went past the Support yesterday, this Support became a new Resistance.

The important thing is that this corresponds with the significant volume area which we identified using Volume Profile.

A combo of two independent trading setups like these makes the Resistance strong.

AUD/CAD; 30 Minute time frame:

I hope you guys liked today’s analysis! Let me know what you think in the comments below.

Happy trading!

-Dale

Do you want ME to help YOU with your trading?

Join one of my Volume Profile Educational courses and get my private trading levels, 15 hours of video content, my custom made Volume Profile indicators, and more!

Comments

Popular posts from this blog

Beginners Guide to Order Flow PART 1: What Is Order Flow?

DEFINITION: Order Flow is an advanced charting software which enables you to read all trading orders that are processed in the market. It helps to track the BIG financial institutions through the trades they make. Most people get confused when they open up a chart with Order Flow for the first time. There is no shame in that. Order Flow shows so many information and it is easy to get overwhelmed and confused if you don’t know what to look for! This Beginners Guide will teach you how to understand how Order Flow works and how you can use it in your trading! In this 1st part of the Order Flow Guide I will show you around the Order Flow interface. Footprints The Order Flow does not show standard candles, but it shows FOOTPRINTS . A footprint shows not only Open, High, Low, Close (as standard candles) but it also shows orders traded in that candle. Orders can be...

NZD/CHF – How To Trade The “b-Shaped” Profile

Today’s intraday analysis will be on  NZD/CHF  and I will start by talking about the structure of the  Weekly Volume Profile . Weekly Volume Profile structure In the previous week, there was a  “b – shaped” Volume Profile histogram formed. b – shaped histogram means that the shape of the histogram  looks like the letter “b”. It says that the market sees the value at the bottom half of the profile while rejecting the upper half. If you look at the picture below, you can see that there was a  rotation  (Monday, Tuesday), then strong  buying activity  (Wednesday), and then an immediate  rejection and a sell-off  (Thursday). Then again a  rotation  on Friday. One of the most important things to notice in a b – shaped profile is a  volume cluster created in the rejection area. In this case, there were two of them. Such a  volume cluster  indicates a place where the  sellers were...

5 Character Traits of a Successful Trader – Tips & Tricks of the Pros!

 Maybe you are interested in trading, and you have taken the first step by researching on forex trading. You might also be currently trading but going through a tough time with your results in the markets and dealing with the recurrent autosuggestion, telling you how this journey might not be for you or you are not capable of achieving successes in this journey. It is essential to know that you are not alone in this feeling, and before you fall into the rabbit hole of depression, feeling like a failure in yet another skill you have chosen. Let me make it clear; the answer is YES, anyone can achieve success in trading , including you. It would only cost you a few character trait adjustments. Before we delve in, it is vital to point out that success i...