
Hello guys,
today’s day trading analysis will be on CHF/JPY.
There has been quite interesting development recently and a new Resistance got formed. Let’s first start with Volume Profile analysis.
Volume Profile Analysis
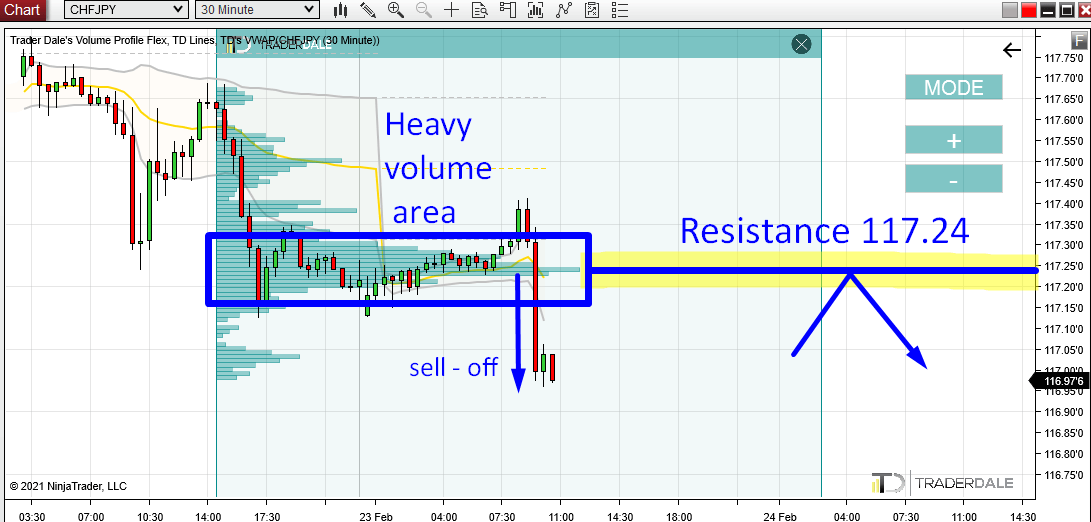
There was a rotation on CHF/JPY which started yesterday in the US session and continued into today’s Asian session.
From this rotation, a strong sell-off started.
If you use my Flexible Volume Profile to look into the rotation area, you can see that massive volumes got traded there. The heaviest volumes were traded at 117.24.
This is where I think strong Sellers were building up their short positions.
Why do I think it was Sellers? Because from this heavy volume zone, a new sell-off started. It seems that Sellers were building up their short positions in that rotation and then they pushed the price downwards aggressively.
So, now we know, that there were strong Sellers around 117.24. This zone is important for them because they placed a lot of their Shorts there.
This is the reason the area around 117.24 should work as a strong day trading resistance.
This is one of my favorite volume-based trading setups. I call it the “Volume Accumulation Setup“.
CHF/JPY; 30 Minute chart:
Price Action Setup: Support Becoming Resistance
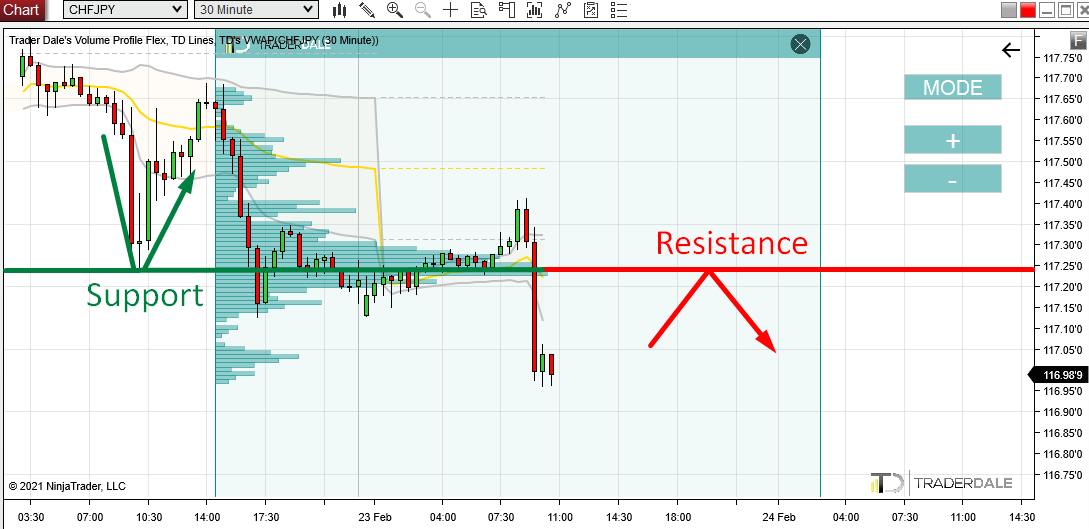
There is more to it than just Volume Profile setup. There is also a Price Action setup which I call the “Support Becoming Resistance Setup“.
Essentially, this setup says that when a Support is breached, it then becomes a Resistance.
As you can see from the picture below, the price made a really strong reaction to the 117.24 zone in the past – it bounced up from it. This means that it worked as a Support.
Then there was the rotation I spoke of and then the Support got breached by those aggressive sellers when the sell-off started. This is when the Support became a Resistance.
Why I talk about this here is because this Price Action Resistance lies exactly at the zone where we also found the volume-based resistance (based on the Volume Accumulation Setup).
This is a nice confluence of trading setups. I am always looking for those!
CHF/JPY; 30 Minute chart:
VWAP Analysis
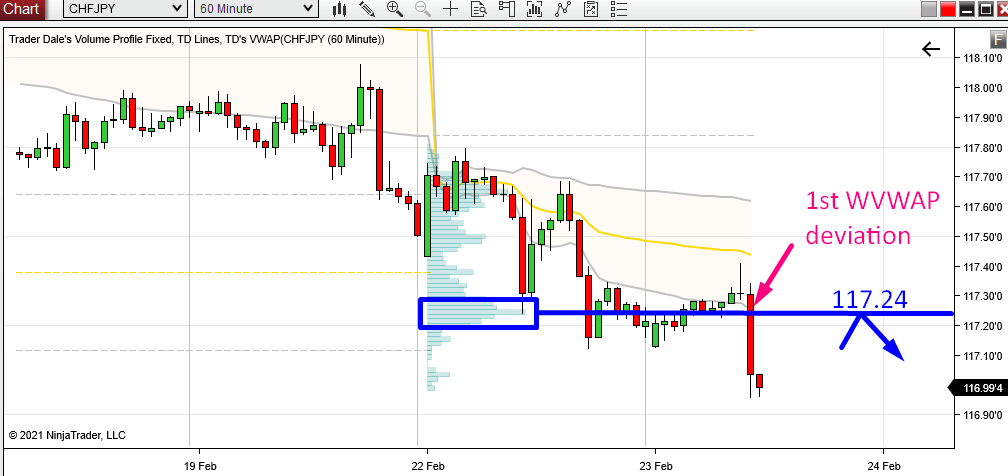
VWAP is another great volume-based tool to look for trading levels.
In this case, there is a very nice confluence since one of my VWAP setups is pointing at the level we identified (117.24).
With VWAP I like to use the “grey” lines as Support and Resistances. Those are 1st Deviations of the VWAP and you can use them as S/R zones when the market is trending as well as when the market is in a rotation.
In this case, the market is trending and you can use my VWAP setup I call the “VWAP Trend Setup“.
The core of the setup is that you wait for the price to go below the 1st Deviation (grey line) and then enter a Short trade whenever the price makes a pullback to this line.
In this case, the grey 1st Deviation is around our 117.24 Resistance, which adds more strength to it.
When the price hits this line, then it should reverse and go downwards again.
CHF/JPY; 60 Minute chart:
Do you want ME to help YOU with your trading?
Summary
All in all, we have three independent trading setups, which all point us to the 117.24 area, telling us that it should work as a Resistance.
Such a confluence of three setups adds to the strength of the Resistance.
The setups we used:
Volume Profile: Volume Accumulation Setup
I hope you guys liked today’s analysis. Let me know what you think in the comments below.
Happy trading!
-Dale
- Get link
- X
- Other Apps
- Get link
- X
- Other Apps
Comments
Post a Comment