
Hello guys,
in today’s analysis, I would like to talk about a trade I had yesterday on USD/JPY (futures symbol: 6J 03-21).
This trade was particularly interesting because this trading opportunity would be COMPLETELY HIDDEN from everyone who does not use Volume Profile or Order Flow.
Let me start from the beginning…
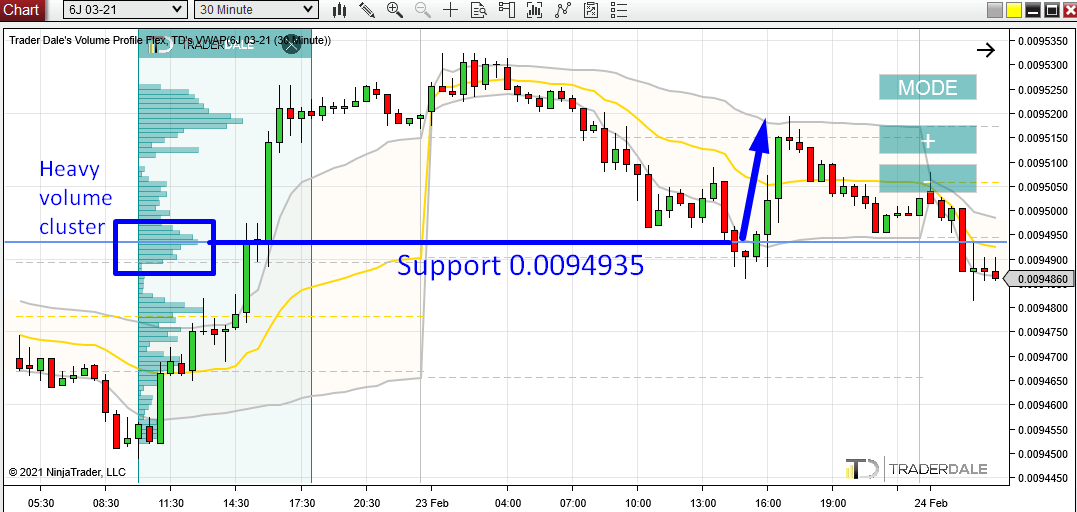
There was a day trading support on JPY Futures (6J 03-21) around 0.0094935. I was talking about my intention of trading this in my Members area in my Daily Levels Commentary video.
This trading level was based on a Volume Profile setup called the “Trend Setup“.
Volume Profile – Trend Setup
The main idea behind this setup was that the price was going upwards and that there were heavy volumes (Volume Cluster) created within this up-move.
Such a Volume Cluster indicates that Buyers were adding to their Long positions there.
To trade this setup, you simply wait for a pullback and go Long from this area. The reason the price should go up again is that Buyers should defend this zone (it is important for them) and push the price upwards again.
You can learn more about my Volume Profile setups for example in this webinar:
Volume Profile Setups (WEBINAR RECORDING)
This trading opportunity was completely invisible for everyone who does not use Volume Profile. That’s why I like trading with Volume Profile so much!
Check the Support out on the JPY Futures (6J 03-21); 30 Minute chart below:
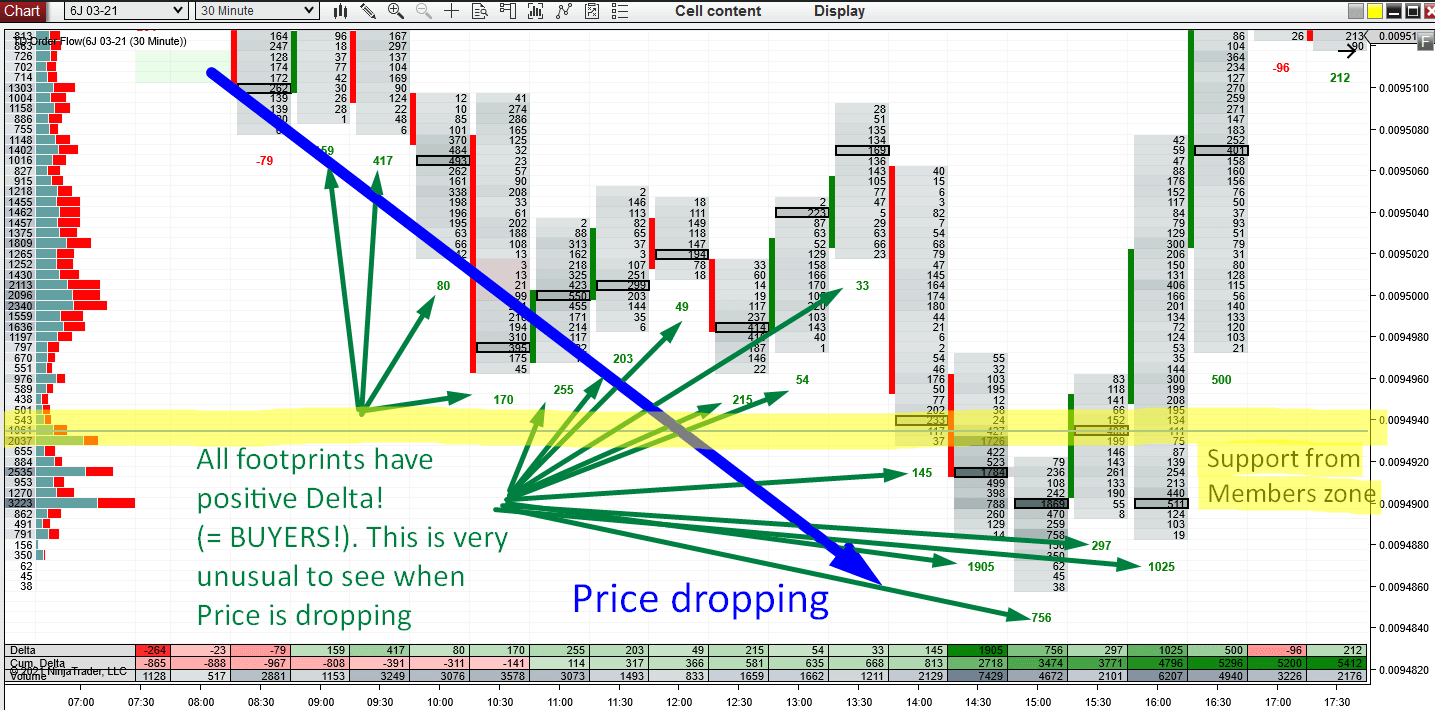
Order Flow
I was shooting my members Daily video, when there was the rotation before the level got hit. In this video, I said that I wanted to see some confirmation of this trade on Order Flow software.
And this brings us to the Order Flow webinar which I had a couple of days ago. One of the
“confirmation setups” I showed at the webinar was a “Divergence between Price and Delta”.
If you don’t know what “Delta” or “Price and Delta Divergence” means, then I suggest you check out the webinar recording here:
ORDER FLOW: Trading Setups (WEBINAR)
In this trade yesterday, there was one of the craziest and biggest divergences I ever saw.
The price was dropping but Buyers were entering their Longs like crazy!
Check it out on this 30 Minute Order Flow chart:
Do you want ME to help YOU with your trading?
Price vs. Cumulative Delta (DIVERGENCE)
Let’s have a look into a more detailed chart, which shows 1 Minute Price versus 1 Minute Cumulative Delta (this is where I mostly look for divergences).
Below, you can see what happened when the price hit the Support zone:
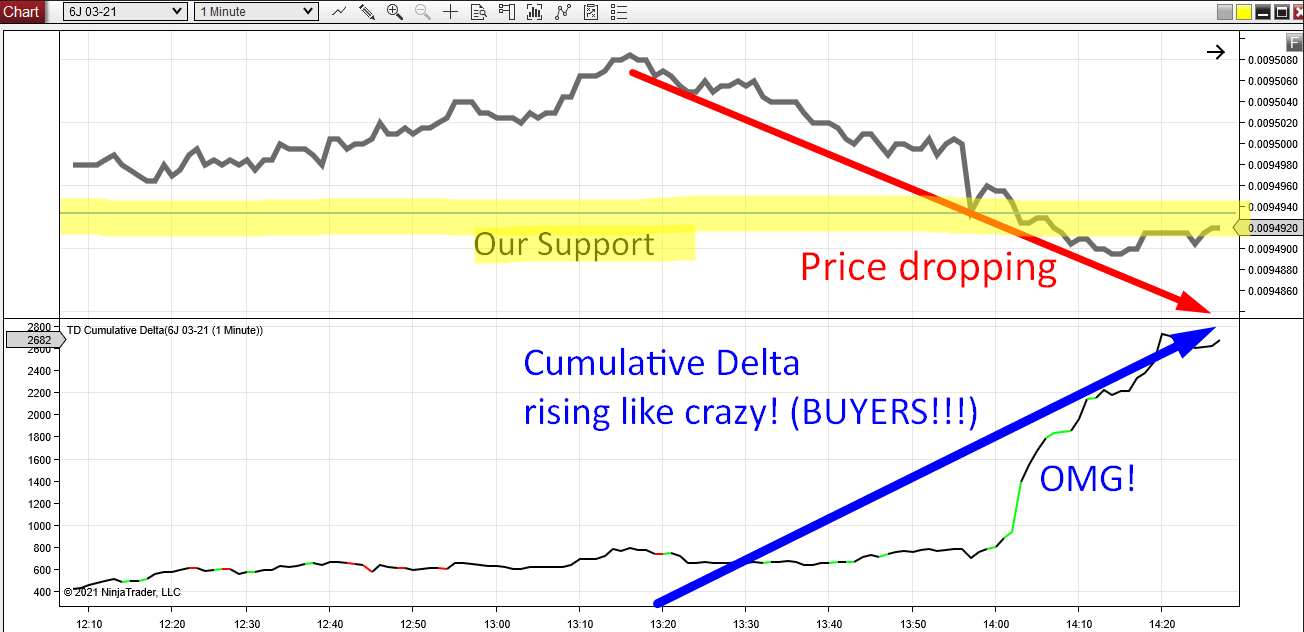
The Price went below my trade entry, but Cumulative Delta was rising like crazy and it was literally shouting at me: BUYERS, BUYERS, BUYERS!!!
This was a very strong confirmation that the Price would most likely turn upwards – strong Buyers were making their move there. This is exactly what you want to see. This is what trade entry confirmation is all about!
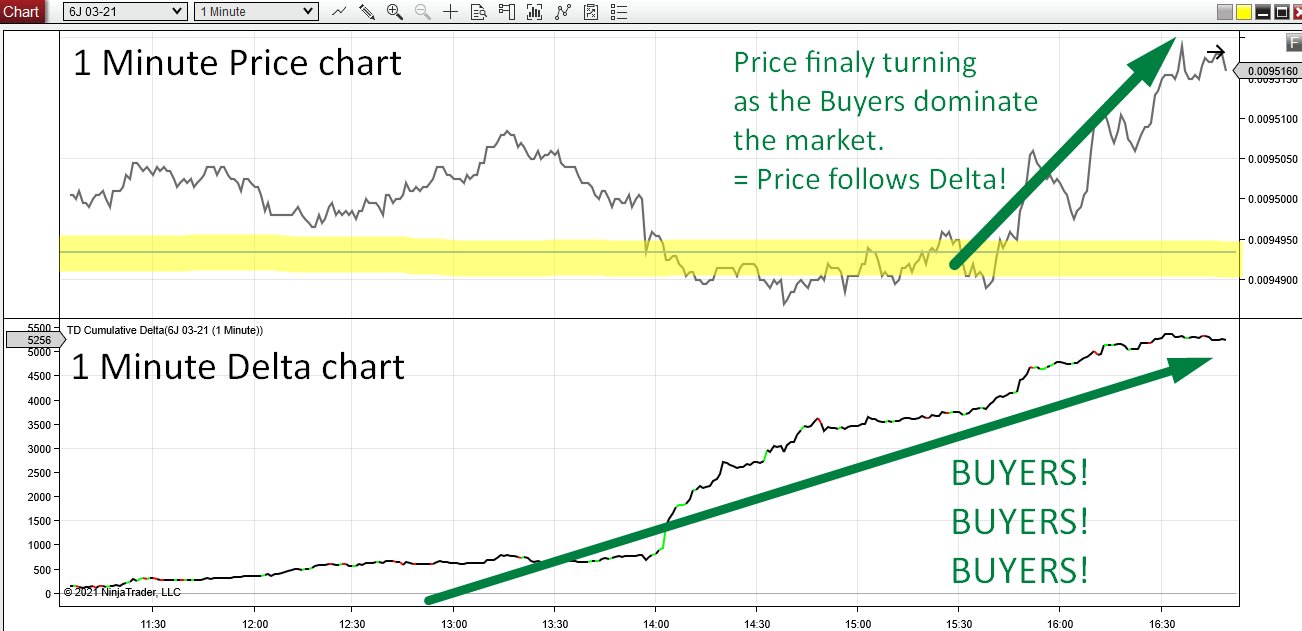
Now, if the price was just rotating below my Long entry without this Delta confirmation, then I would be pretty nervous. I would most likely try to quit the trade around Break Even. BUT because there was this massive divergence, I was pretty confident and almost certain that the price will rise dramatically.
That’s exactly what happened. Check it out on the chart below:
An Invisible Trading Opportunity
What I like about this the most is that this trade was completely invisible to everybody who does not follow volumes.
Trade entry was based just on volumes. Then when the price hit the Support, we used Order Flow to see what was going on. People without Order Flow or Delta would not see it! They would just see the price shooting past their level without much of a reaction.
See the difference? That’s exactly what I was talking about at the Order Flow webinar!
I hope you guys liked this trade analysis. Let me know what you think in the comments below!
Happy trading!
-Dale
P.S. At the end of the webinar I made a special offer for those who would like to get my Order Flow software as well as my Order Flow training course.
This special offer is a 40% discount and you can get it until the end of February 2021 HERE
- Get link
- X
- Other Apps
- Get link
- X
- Other Apps
Comments
Post a Comment