
EUR/NZD: Volume Profile Analysis


Trader Dale - Free Book

Hello guys,

today’s day trading analysis will be on EUR/NZD.

The first important thing to notice is the strong uptrend which started yesterday.

When there is an uptrend like this, I always like to use my Flexible Volume Profile indicator to look for significant Volume Clusters.

Those Volume Clusters are sort of “bumps” that show on the Volume Profile in the trend.

The most significant Volume Cluster in the current trend area has now occurred around 1.6849.

So, what’s the story?

As the buyers were pushing the price upwards into that trend, they slowed down around the 1.6849 and they started to add to their Long positions.

This is what created the Volume Cluster.

Afterwards, they started to push the price aggressively upwards again – trend continues.

EUR/NZD; 30 Minute chart:

Now we know, that the area around 1.6849 is a very important zone for the big institutional traders, who were entering their Long trades there.

When the price makes it back to this area again, we can expect that those buyers will want to defend this zone.

We can expect that they will start buying again, and that this will drive the price upwards from there again.

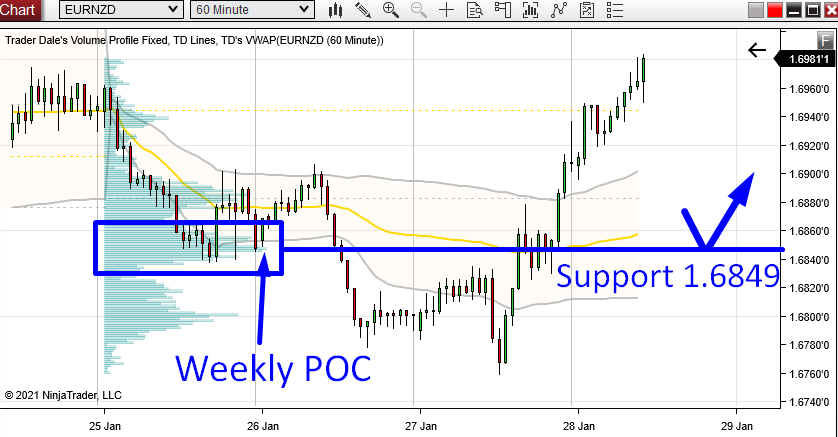
This is why I think the 1.6849 could work as a strong day trading Support.

Weekly POC

A nice addition is that our Support lies exactly at the Weekly Point Of Control (POC).

The Weekly POC represents a place, where the most volumes got traded through the whole week.

I always like to look for Weekly POCs in my trading, because they often represent strong trading levels.

EUR/NZD; 60 Minute time frame:

*My Volume Profile automatically prints the Weekly Volume Profiles, where you can easily spot the Weekly POCs.


I hope you guys liked today’s analysis. There are more in the MARKET ANALYSIS section. Check them out!

Happy trading!

-Dale

Do you want ME to help YOU with your trading?

Join one of my Volume Profile Educational courses and get my private trading levels, 15 hours of video content, my custom made Volume Profile indicators, and more!

Comments

Popular posts from this blog

Bitcoin is Dropping Hard! Here’s Where Smart Money Will Buy Again

Video Transcript: Hello everyone, it’s Dale here. In today’s video, I’d like to talk about Bitcoin. The reason is that Bitcoin has been dropping like crazy, and a lot of traders are wondering where Bitcoin will go and what to expect. If I look at the chart and use Volume Profile, I would say that it’s pretty straightforward because Volume Profile very clearly shows the strongest support and resistance levels. So, let’s take a look at the chart, and let me show you. What you see before you is the daily chart of Bitcoin. This is the big picture, and as you can see, from the all-time high here, Bitcoin experienced quite a significant sell-off and is currently dropping. Right now, I don’t really see any strong support that would stand in the way of this strong sell-off. Let me use Volume Profile and show you what could actually stop the sell-off of Bitcoin. All right, so what I’m going to do is apply Volume Profile over this whole area to see the volume distribution. As you can see, there ...

Quick In & Out Trade on USD/JPY – Smart Money Concepts & Volume Profile

Video Transcript: Hello everyone, it’s Dale here. Welcome to the next video of the new series, where I’ll talk about my recent trades. Today’s trade is on the  USD/JPY . It was a very quick in-and-out trade, so let’s check it out. What you see before you is the 30-minute chart of the  USD/JPY , and the level I was trading from was this short level at  149.63 . The reasoning behind this level—let me zoom in a little so you can see this better—was the volumes that formed here. From this place, there was a sharp sell-off. Even though the volumes do not particularly stand out, what’s important is that from this zone, there was a strong sell-off. There was also a  Fair Value Gap . My software highlights that, but when the gap is filled, it’s not highlighted anymore. If I mark it for you, this was the Fair Value Gap, which is a setup from Smart Money Concepts. I like to trade from the beginning of the Fair Value Gap, which is here. This is also the beginning of a heavy vol...

ORDER FLOW: How to Trade the Absorption Setup (Trade Entry Confirmation)

Video Transcript: Hello everyone, and in this video, I’d like to talk about order flow and one of my favorite confirmation setups in order flow. The confirmation setup is called the absorption, and I’ll show you an example of a trade I made a couple of days ago. I think this is the perfect example of how you can use the absorption setup to confirm your trade entry. So, let’s take a look at it. First, let me start by showing you the level I wanted to trade, and then I’ll show you the absorption setup. You’re looking at the  EUR/USD  30-minute chart, and I had a long level here, marked by this line. This was a long level based on a Volume Profile setup, focusing on those heavy volumes formed within this important rejection. So, this was the long level. What happened was that the price started to go into a sudden sell-off, and there wasn’t really any strong macro news behind this. I wasn’t really sure what was going on, but there was this sudden sell-off, this spike move. Because...