
USD/CHF: Volume Profile, Price Action, and VWAP Analysis

 Trader Dale - Free Book

Hello guys,

the recent macro news started a pretty strong reaction on the EUR. As you may know, the EUR is very closely linked to the CHF currency. This caused the USD/CHF to move as well as the EUR/USD.

In this day trading analysis, I will focus on the USD/CHF.

What I found interesting there is that the price finally broke a price channel, it breached many strong lows, and now moves below them.

Let’s start with Volume Profile analysis and get back to the price action a bit later.

Volume Profile Analysis

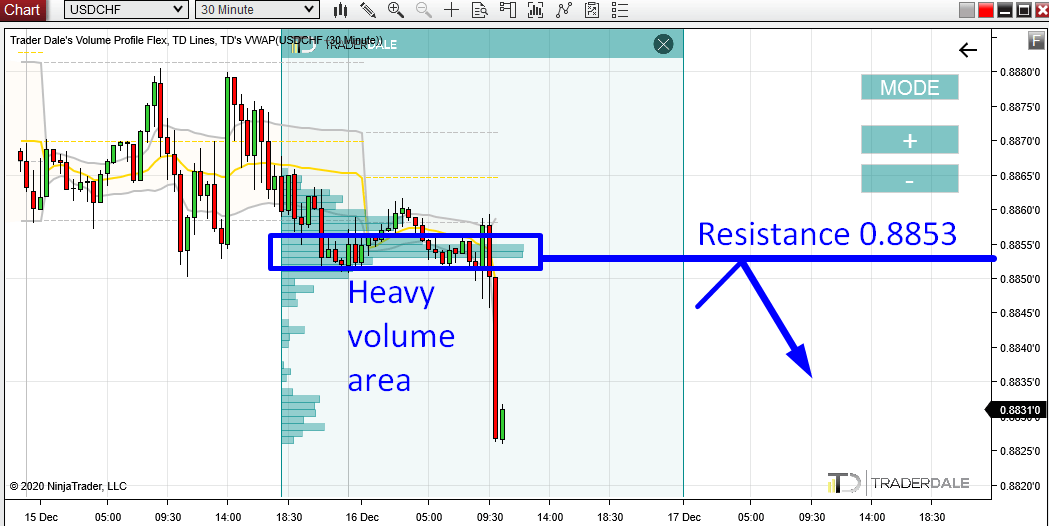
Before the strong sell-off started a couple of moments ago, there were quite heavy volumes accumulated. To me, it seems, that sellers were accumulating their Shorts, and then they started to sell aggressively to push the price into a new trend.

The place where the volumes were the heaviest is around 0.8853. That’s the POC and the most important volume zone in this area.

When the price makes it back to this area again it is likely that the price will react to it. The reason is that the big institutions that placed their Shorts around 0.8853 will want to defend this area.

This setup is called the “Volume Accumulation Setup

USD/CHF; 30 Minute time frame:

Price Action

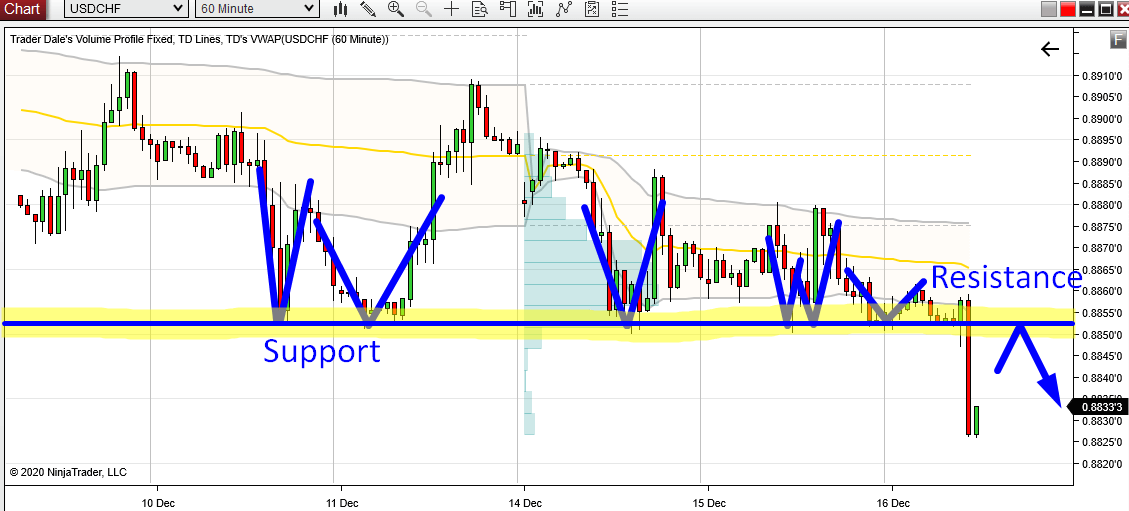
In the chart below, I highlighted all the strong reactions to the 0.8853 zone in the past. As you can see it worked as a pretty strong Support! The price bounced off it 5 times! Now, the Support got breached and it turned into a Resistance.

The cool thing is that this nicely aligns with the Volume-based resistance I showed you.

USD/CHF; 60 Minute chart:

Do you want ME to help YOU with your trading?

Join one of my Volume Profile Educational courses and get my private trading levels, 15 hours of video content, my custom made Volume Profile indicators, and more!

VWAP

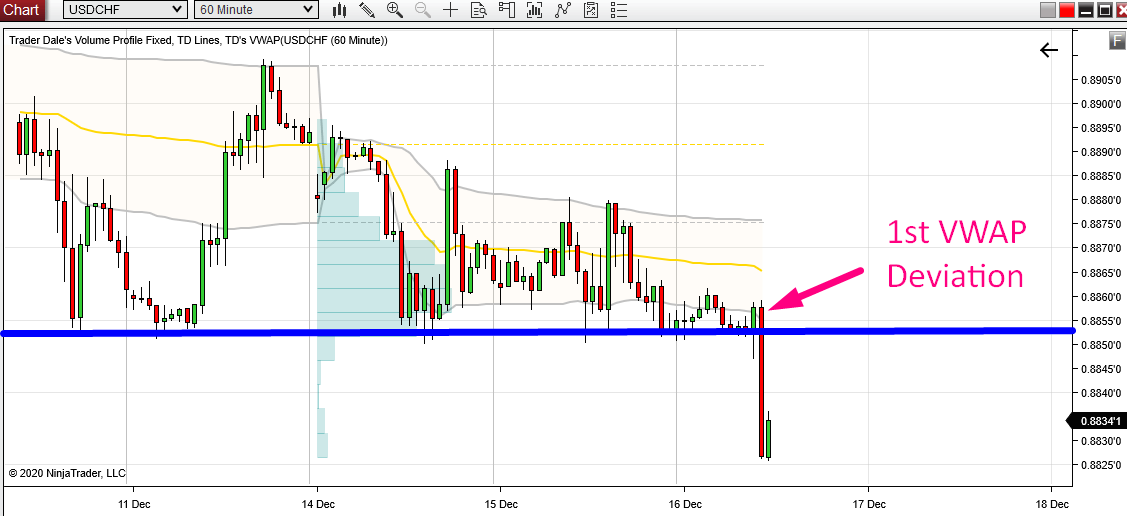
There is one more nice little addition to all this. It is a VWAP setup.

The picture below shows a Weekly VWAP with its 1st deviations (the grey lines). Those Deviations work as Support/Resistances.

Currently, the 0.8853 resistance is very close to the lower 1st Deviation. If the price makes it back to this area, while the 1st Deviation is still around, then it will be a nice confirmation of the Resistance.

USD/CHF; 60 Minute chart:

I hope you liked today’s analysis. Let me know what you think in the comments below!

Happy trading!

-Dale

P.S. I have just released a new book called ORDER FLOW: Trading Setups. If you purchase one of my trading courses (now -50% Discounted – Christmas Sale), you will get the book for free!

Volume Profile Course – 50% discount

Order Flow Course – 50% discount

*The book is now EXCLUSIVE to members of my trading courses (not available in any store)

Comments

Popular posts from this blog

How to Track The Institutions With Volume Profile – Weekly Trading Ideas 6.4.2020

*Disclaimer: Presented opinions, trades and trading ideas on the markets and charts is not advice nor a trading recommendation. It is general information and it is for educational purposes only. **You can learn more about my trading setups in my new book: VOLUME PROFILE: The insider’s guide to trading If you would like to learn to trade with Volume Profile and to trade with me every day, then join my Trading Course!

Recent Trade Breakdown: Combining Price Action & Volume Profile for Smarter Trades

Video Transcript: Hello everyone, it’s Dale here. In this new video series, I want to break down my recent trades. The goal of this series is to show you how I use my Volume Profile trading setups every day in real market conditions, so you can learn from both my wins and my mistakes. If you find this helpful, don’t forget to hit the like and subscribe buttons. Let’s dive in. What you see before you is a screenshot from my session yesterday. It’s taken from the live trading room we held in the  Funded Trader Academy . During that session, a new setup was forming on the  AUD/USD . This is the  AUD/USD  on a 30-minute timeframe, and the new setup was forming right here. There was a resistance level forming around  0.6364 . The reason behind this setup was based on a couple of factors. The main reason was a Volume Profile setup. If you look here at what I’ve highlighted, this area represents a heavy volume zone, which the resistance level was based on. You can see ...

ORDER FLOW: How to Trade the Absorption Setup (Trade Entry Confirmation)

Video Transcript: Hello everyone, and in this video, I’d like to talk about order flow and one of my favorite confirmation setups in order flow. The confirmation setup is called the absorption, and I’ll show you an example of a trade I made a couple of days ago. I think this is the perfect example of how you can use the absorption setup to confirm your trade entry. So, let’s take a look at it. First, let me start by showing you the level I wanted to trade, and then I’ll show you the absorption setup. You’re looking at the  EUR/USD  30-minute chart, and I had a long level here, marked by this line. This was a long level based on a Volume Profile setup, focusing on those heavy volumes formed within this important rejection. So, this was the long level. What happened was that the price started to go into a sudden sell-off, and there wasn’t really any strong macro news behind this. I wasn’t really sure what was going on, but there was this sudden sell-off, this spike move. Because...