DAX: New All-time High Coming Soon?

Hello guys,
today I am going to focus on a long-term analysis of DAX.
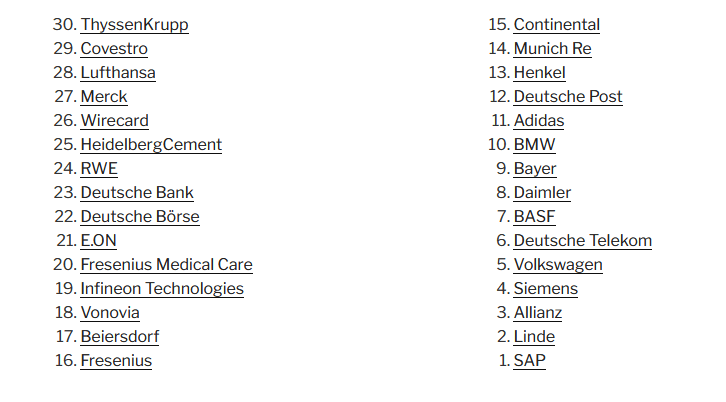
DAX is a stock index which consists of the 30 biggest companies listed on the Frankfurt Stock Exchange. It does not represent just those 30, but the whole German industry as also other German companies, and their stocks are very tightly knit with DAX.
Simply put – if DAX goes down, then the majority of German companies go down as well (not just the 30).
Here is a list of companies DAX consists of:
Price Action analysis
Let’s start with a simple Price Action analysis. In here, I will focus only on one thing – comparing strength of Buyers with the strength of Sellers. This could give us an idea of where DAX could be heading next!
What matters the most is the aggressivity of Buyers vs. Sellers.
Aggressive Buyers or Sellers create strong trends and strong rejections of higher or lower prices.
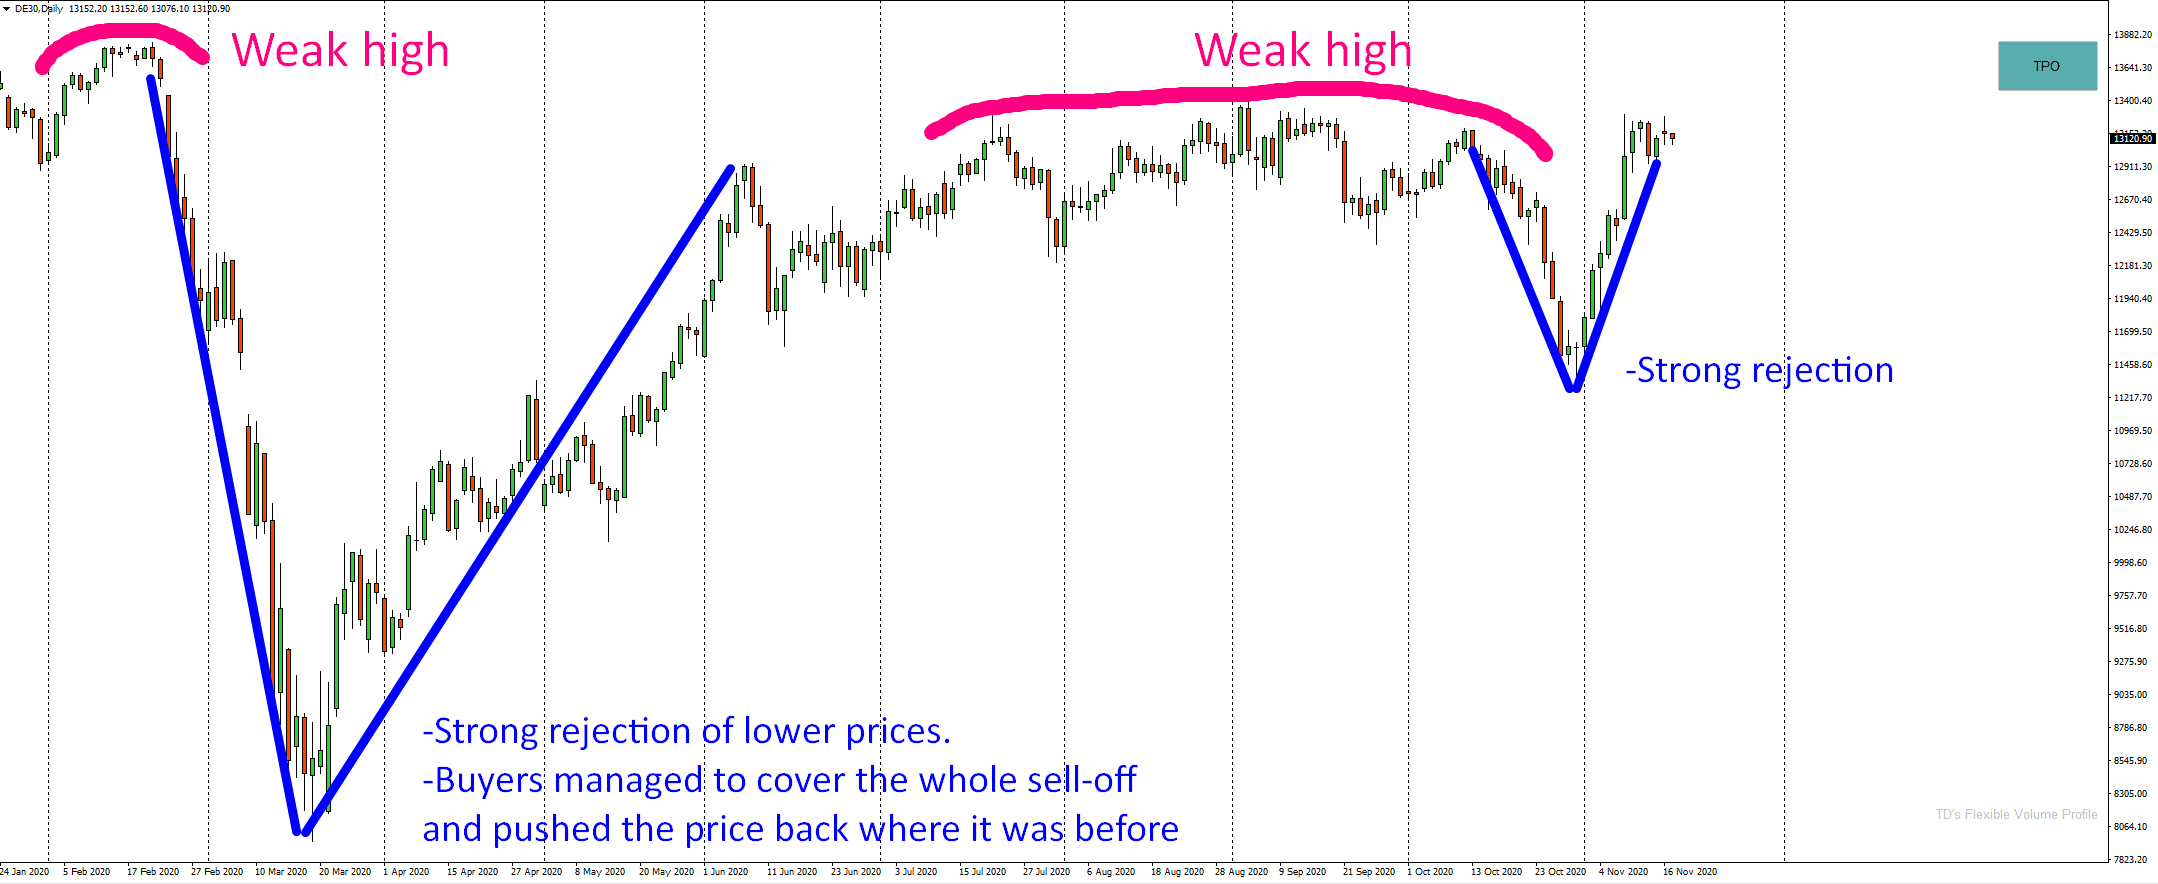
Let’s have a look at the chart below. In there, I compared aggressivity of Buyers (blue) vs. Sellers (red).
BUYERS:
There are two very strong rejections of lower prices.
The first one is actually super-strong rejection. There was a crazy sell-off but then the Buyers were able to turn the price and push it all the way back where it was before.
The second rejection is also pretty strong and sharp. It occurred only a few days back. It also represents strong and aggressive Buyers who rejected the lower prices.
SELLERS:
So, what about sellers? There was this crazy strong sell-off in February and March, but it already got completely “covered” by Buyers. Those basically negated this whole move.
After that, there was no sign of strong selling activity.
What we see are only “weak highs” – and the price likes to test those!
BUYERS vs SELLERS:
To me, the picture below gives me a clear message: There are strong Buyers and weak Sellers.
The all-time high on DAX is weak and therefore the price is likely to test it and push the price above it. To create a new all-time high!
DAX, Daily chart:
Do you want ME to help YOU with your trading?
Volume Profile analysis
Let’s now have a look at some volume-based Supports on DAX!
I used my Volume Profile to look into this rejection to see how the volumes were distributed there.
The Volume Profile shows three important zones that got created in the strong rejection of lower prices.
In all three areas there were heavy volumes traded. Those volumes were most likely volumes of strong Buyers who were adding to their Long positions as they were pushing the price upwards.
Those zones are important for those Buyers and therefore they should work as strong supports. When the price makes it back there at some point in the future those buyers are likely to become active and defend those areas.
The heaviest volumes within the rejection got traded around: 10.550; 9.630; and 9.100. Those are currently the strongest volume-based Supports on DAX.
DAX, Daily chart:

In my opinion, the strongest one of them is the first one (10.550). The reason is that the heaviest volumes were traded, there and also that a strong buying activity starts from there. As a bonus, the pinbar right before the strong buying activity started to continue also adds to the strength of this support.
I hope you guys liked this analysis. Let me know what you think in the comments below.
Happy trading!
-Dale
PS. Don’t miss the Black Friday SALE! Now you can get my best educational packs (Elite Pack and Order Flow Pack) with a -50% discount. That’s the lowest price ever!
Check them out here:
Elite Pack (-50% discount): CLICK HERE
Order Flow Pack (-50% discount): CLICK HERE

- Get link
- X
- Other Apps
- Get link
- X
- Other Apps
Comments
Post a Comment