Today, I will do an intraday analysis of CAD/JPY. There are quite a lot of interesting things to point out here!
There was a strong trend movement on CAD/JPY yesterday. If you are reading my Market Commentary articles from time to time, then you know that I like to look for significant “volume clusters” within such trends.
Trend analysis with Volume Profile
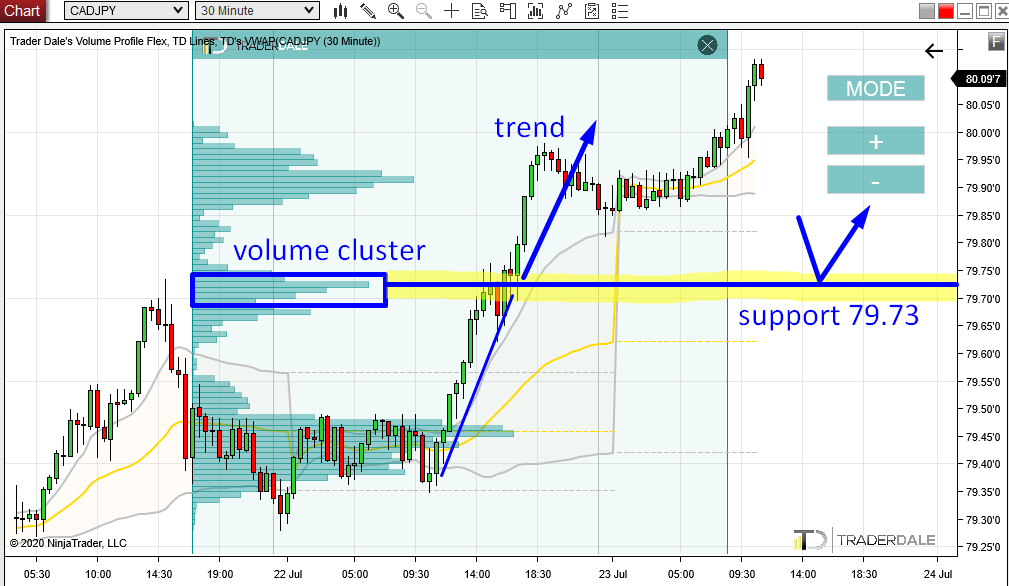
What I do is that I use my Flexible Volume Profile and I stretch it over the whole trend area. Then I look for places with heavy volumes within the trend (= volume clusters).
In this case, there was a strong volume cluster created around the middle of the trend movement.
A volume cluster in an uptrend tells us, that the buyers who were pushing the price upwards into the trend were adding to their long positions there – at the volume cluster.
How does this information help us? It helps us because when the price makes it back into this volume cluster area again, the buyers who entered their long positions there are likely to become active and to push the price upwards again.
This is why such a volume cluster represents strong support. In this case, the support is around 79.73.
CAD/JPY; 30 Minute chart:
Recommended Forex Broker
Having a solid broker with low spreads and commissions is ESSENTIAL for PROFITABLE TRADING! Check out my recommended brokers
Price Action setup
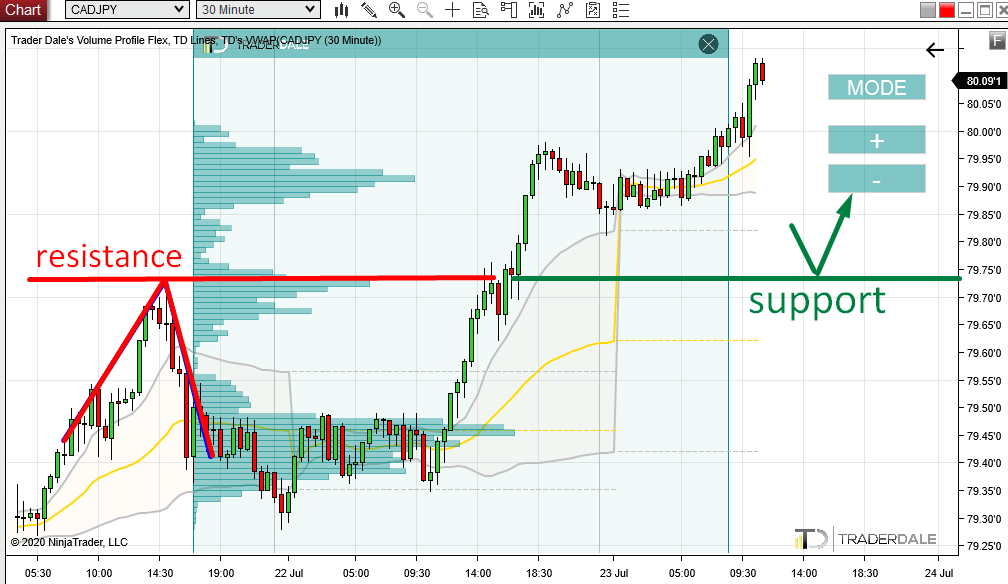
There is also another piece of information that confirms this 79.73 support.
It is a simple Price Action setup which tells us that a breached resistance becomes a support. This is, in fact, my favorite Price Action setup.
As you can see from the picture below, the price already reacted to this 79.73 zone in the past. It worked as a resistance.
Now, when the price went through this resistance, it became a support.
CAD/JPY; 30 Minute chart:
A significant Volume Accumulation area
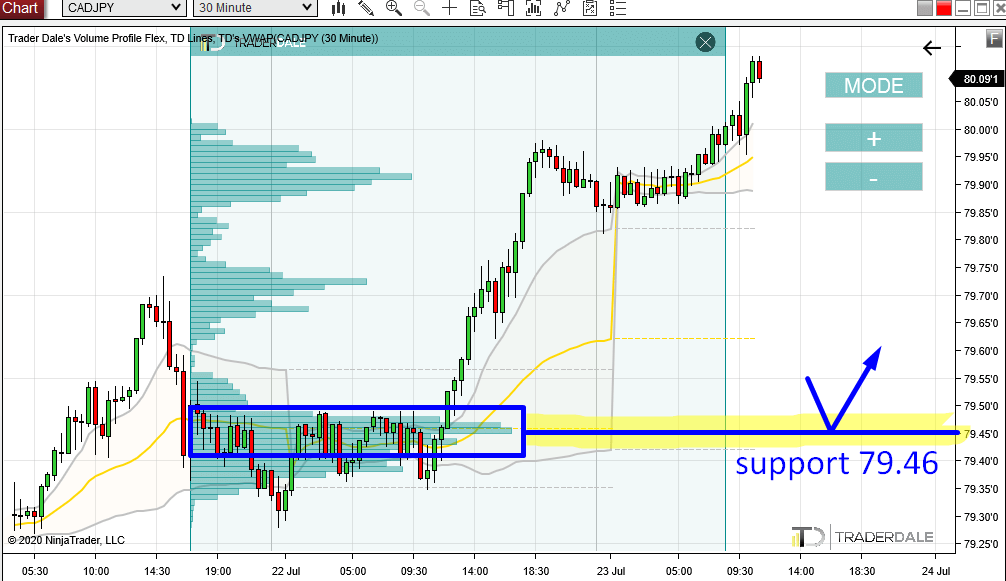
Another significant area on CAD/JPY is the place from which the new uptrend started.
Strong trends usually start from a rotation and in this case, it was also like that. The reason for this is that the big trading institutions need to get ready for a big move.
They don’t enter their positions like you and me with one click. They need to accumulate their massive positions without being noticed. The best place for this is in a rotation.
When the price makes is back into an area where they accumulated their longs, those big guys are likely to defend their longs. They do that by pushing the price upwards. That’s what makes this area (79.46) a strong support.
An ideal way to identify such an area is to use my Flexible Volume Profile to look for the volume accumulations within rotations which were followed by a trend.
I call this a “Volume Accumulation setup” and you can learn more about it in my Volume Profile book, which you can download for FREE by clicking the banner below:

Weekly Point of Control (POC)
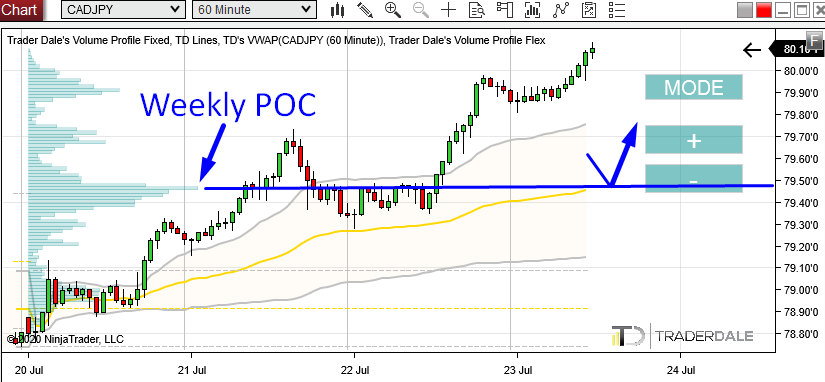
Apart from the Volume Accumulation setup, there is also one more thing confirming this 79.46 support.
It is the Point of Control (POC) of the Week. A Weekly POC is best visible on a Fixed Weekly Volume Profile (you can get this as a part of any educational pack from HERE).
It shows where the heaviest volumes were traded throughout the whole week. In this case, it nicely aligns with our support at 79.46 as the support lies EXACTLY at the Weekly POC.
Whenever you see a strong trend starting from a Weekly Point of Control, you should pay attention to it. Such POC often works as an important place which the big trading institutions keep an eye on.
The reason is that this is usually the place where they entered most of their trading positions.
CAD/JPY, 60 Minute chart with Weekly Volume Profile:
I hope you guys liked today’s analysis. Let me know what you think in the comments below!
Happy trading!
-Dale
- Get link
- X
- Other Apps
- Get link
- X
- Other Apps
Comments
Post a Comment