Today, I would like to show you a nice confluence of two trading strategies on EUR/JPY.
The analysis I am going to do will be an intraday trade analysis and I will do it on a 60 Minute chart.
The reason why it caught my eye was that a tight rotation followed by a sell-off is what I look for in my Volume Accumulation trading strategy.
What I also want to see with this strategy is heavy volumes traded in the rotation.
In this case, those volumes were really easy to spot because they show very nicely on the Weekly Volume Profile.
If this wasn’t as easily visible on the Weekly Volume Profile then I would use my Flexible Volume Profile to look just into this rotation area. However, in this case, there was no need for that.
Volume Profile analysis
The thing which got me interested first in this chart was a tight rotation, which was followed by a rejection of higher prices and then an immediate sell-off.The reason why it caught my eye was that a tight rotation followed by a sell-off is what I look for in my Volume Accumulation trading strategy.
What I also want to see with this strategy is heavy volumes traded in the rotation.
In this case, those volumes were really easy to spot because they show very nicely on the Weekly Volume Profile.
If this wasn’t as easily visible on the Weekly Volume Profile then I would use my Flexible Volume Profile to look just into this rotation area. However, in this case, there was no need for that.
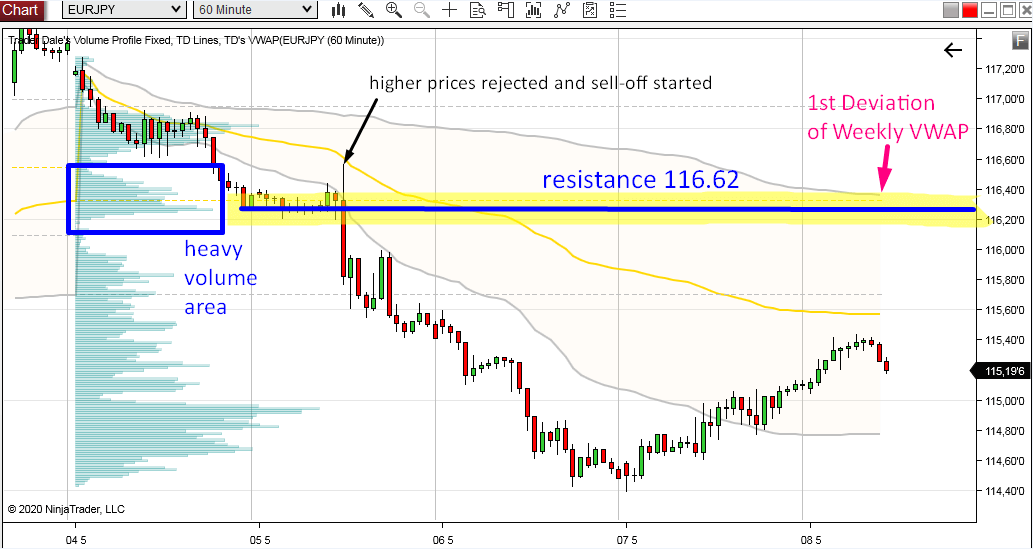

So, what I think happened there was that sellers were accumulating their selling positions in the rotation area (blue rectangle). Then they rejected higher prices aggressively, and then they started the sell-off.
Now the price is slowly making it’s way upwards. If the price gets in the heavy volume area again, then those sellers who were accumulating their shorts there will want to defend this area. They will want to defend their short positions!
What I think will happen is that those sellers will start aggressively selling again and they will push the price downwards again.
This is why I think this will work as a resistance (around 116.62)
There doesn’t need to be another sell-off from there again, maybe just 15-20 pip reaction. But even if it is only this small reaction then it should be enough to take an intraday trade there and grab a quick profit.
Weekly VWAP confluence
What I also like about this resistance area is the Weekly VWAP, and mostly it’s First deviation (the grey line). The upper first deviation of this week hasn’t been tested yet and it is almost exactly at the resistance which I identified using the Volume Profile!If the price touches this 1st deviation then I expect a selling reaction. And it does not need to be today. It can also be the next week…
This is the kind of trading signal I like to see most! When a Volume Profile strategy points to the same level as VWAP trading strategy then this creates the strongest trading levels.
I hope you guys liked this analysis, let me know what you think in the comments below!
Have a nice weekend, stay safe and happy trading!
-Dale
Have a nice weekend, stay safe and happy trading!
-Dale
- Get link
- X
- Other Apps
- Get link
- X
- Other Apps
Comments
Post a Comment