Some of you probably know that I am developing my own Order Flow software. It is not 100% ready for release yet, mostly because I still need to finish a video course that will go with it.
I guess that all will be finished within a month or so… (no guarantees :))
My plan was to present it to you when it was all 100% done and finished but I just couldn’t wait! So this will be the first short article about using the Order Flow in real trading.
*I am not going to talk about all the features and strategies here (you will learn all that in the Order Flow Video Course) but I will just jump right into it and show you how to use Order Flow in your trading.
Order Flow as a confirmation to Volume Profile
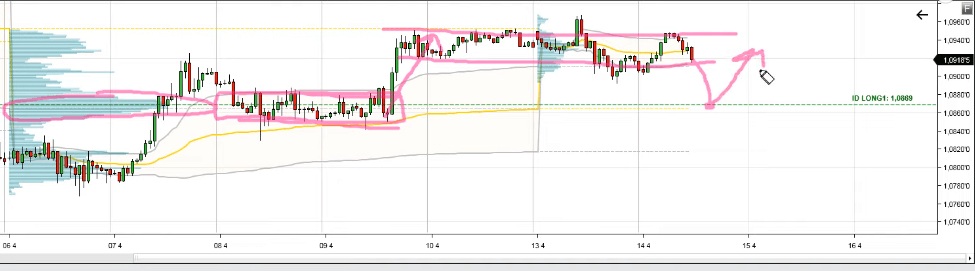
One of the ways you can use the Order Flow is to look for a confirmation in strong support/resistance zones.As an example, I will use a support which I showed you on Tuesday in a Weekly Trading Ideas video. This one:
How To Trade The Weekly POC – Weekly Trading Ideas 14.4.2020
The support I talked about was on EUR/USD at 1.0869. This was the prediction (screenshot from the video):
This is how the trade went:
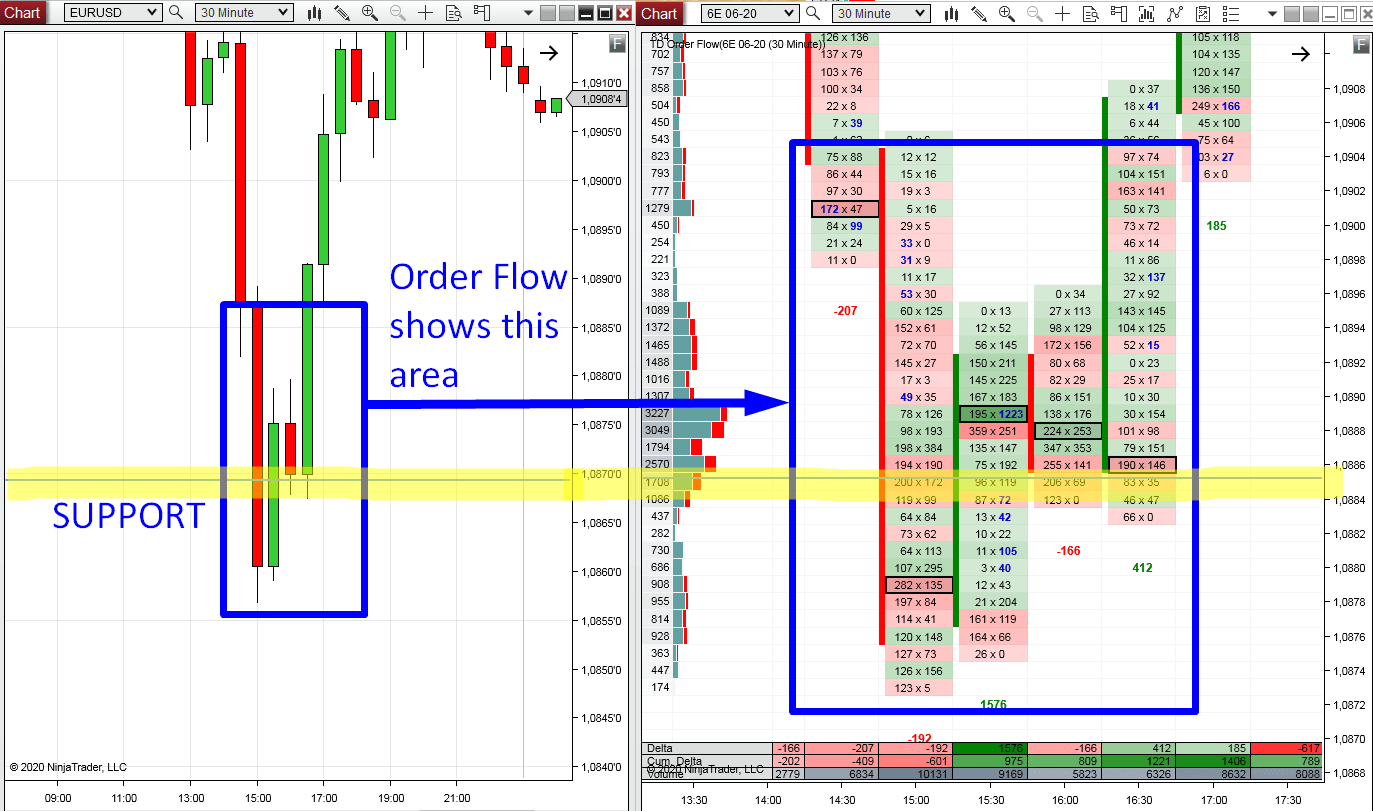
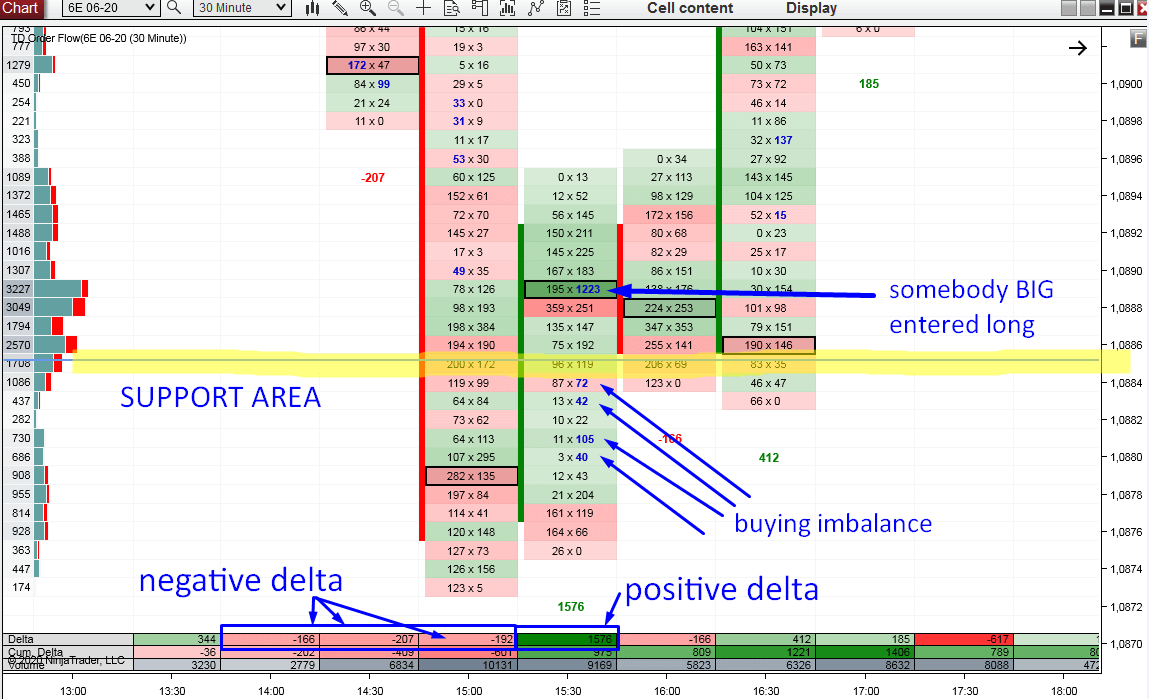
The picture below shows a candle chart of EUR/USD (with the support from the video) and also the zoomed-in Order Flow chart of the same area (both 30 minute time frame):
The picture below shows a candle chart of EUR/USD (with the support from the video) and also the zoomed-in Order Flow chart of the same area (both 30 minute time frame):

Important notice before we jump into it
Before I start talking about what the Order Flow showed when it hit the support, I need to tell you two important things:1. Supports/resistances are NOT EXACT levels. They are ZONES. In those zones we want to see a confirmation that the big guys are going to react to these zones.
2. I prefer using Order Flow on Futures charts (because those are centralized – as opposed to Forex which is decentralized). So, I trade Forex but I look at Futures. That’s why the pictures below are not on EUR/USD but on 6E 06-20 (EUR Futures). The prices are bit different but the correlation is almost 100% (they move exactly the same).
ORDER FLOW ANALYSIS
When the price hit the support area (which was based on Weekly Volume Profile) I was looking for some sort of confirmation on the Order Flow.At first there was nothing and the price overshot the 1.0869 (forex) level (but it was still in the support area which was around 20 pip wide). Then three nice confirmations on the Order Flow appeared:
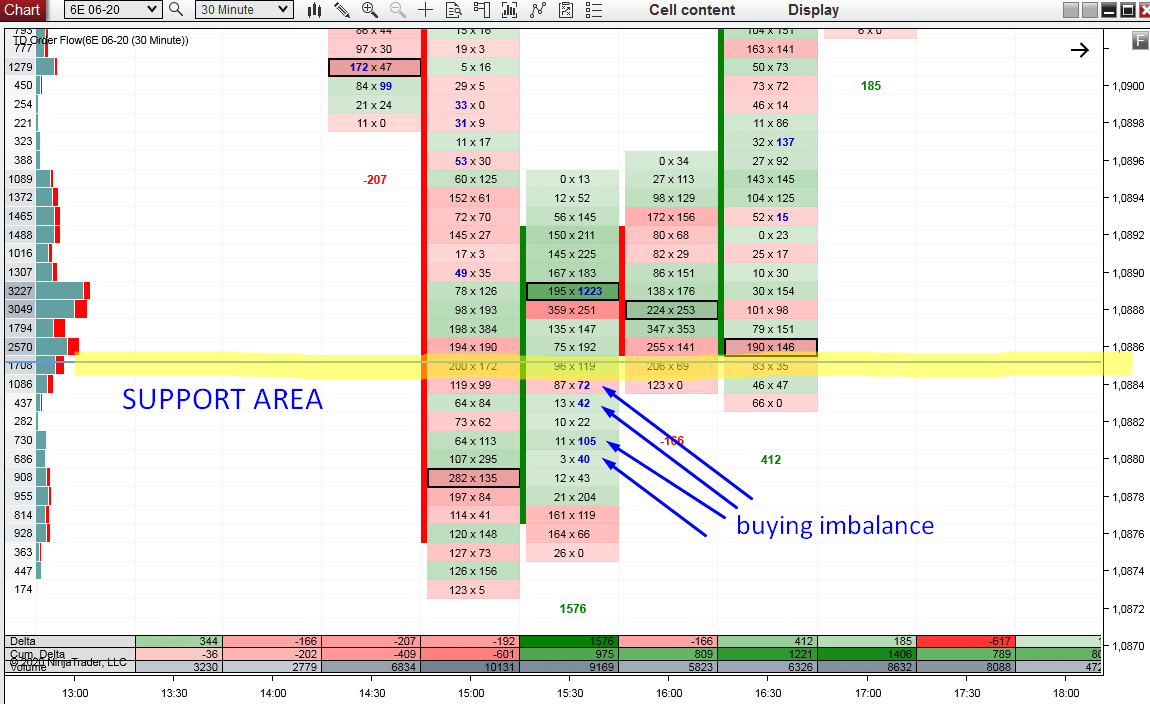
#1 Confirmation: Buying imbalances
Strong and aggressive buyers started to jump in.How do I know there were strong and aggressive buyers? If you look at the chart below, then I marked four BLUE numbers. Those are called “Buying imbalances“. They mean that buyers are way more stronger & aggressive than sellers (there are way more volumes traded on the Offer side than on the Bid side).
#2 Confirmation: A BIG order
Shortly after the strong buyers started to jump into their longs, there was a crazy big order (1223 lots) placed on the Offer (aggressive buy order). This was another nice confirmation because some BIG guy was waiting for this level and he has just entered the game! That’s what you want to see – big guys on your side 🙂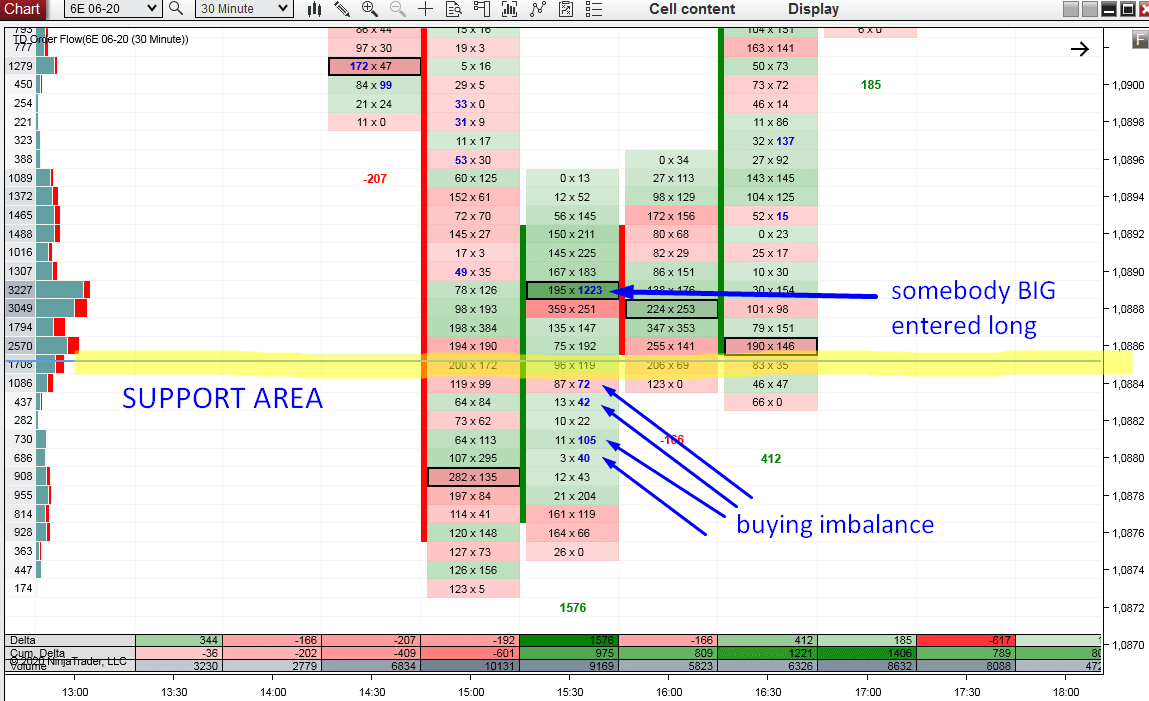
#3 Confirmation: Positive Delta
The table at the bottom shows (among other things) Delta.Delta essentially shows the difference between Bid (sellers) and Offer (buyers) in a given candle.
In the picture below, you can see that at first the Delta was NEGATIVE (-166, -207, -192). Then it turned greatly POSITIVE (+1576).
This means that there were more aggressive buyers than sellers.
That’s another confirmation I like to see when a price reaches a support!
Even one
of those three confirmations would be the final push I would need to
enter the long. Having three of them – that is gold!
I hope you guys liked today’s Order Flow analysis! Let me know what you think in the comments below!
Happy trading!
-Dale
P.S. – Answers to most common questions about my Order Flow 🙂
Happy trading!
-Dale
P.S. – Answers to most common questions about my Order Flow 🙂
- I don’t know the exact release date yet (I hope within a month)
- I don’t know the price yet, but don’t worry I don’t want it to be expensive.
- It will be only for NinjaTrader 8 platform. No MT4/MT5.
- Get link
- X
- Other Apps
- Get link
- X
- Other Apps
ReplyDeleteHey, thanks for the information. your posts are informative and useful. I am regularly following your posts.
DYNAMIC PORTFOLIO MANAGEMENT & SERVICES LTD