Price Action Analysis
Today, I will do an intraday analysis of CAD/JPY.
What caught my eye when I went through the charts in the morning, was that there was a rotation from which strong buying activity started.
This usually means that there were buyers entering their long positions in that rotation. After they have entered their longs, they started aggressive buying to push the price upwards – to make money on the longs which they placed in the rotation.
I am always interested when I see Price Action like this.
*I call this a Volume Accumulation setup and you can learn more about it here: Volume Profile Setups
The heaviest volumes were in the rotation area, and the heaviest volume peak (where most of the trades got placed) was around 76.38.
This is where the buyers placed most of their longs. This is a support they will want to defend.
So, if the price makes a pullback to this area I think that those buyers will be defending their longs and they will start aggressive buying again to push the price upwards again.
What caught my eye when I went through the charts in the morning, was that there was a rotation from which strong buying activity started.
This usually means that there were buyers entering their long positions in that rotation. After they have entered their longs, they started aggressive buying to push the price upwards – to make money on the longs which they placed in the rotation.
I am always interested when I see Price Action like this.
*I call this a Volume Accumulation setup and you can learn more about it here: Volume Profile Setups
Volume Profile Analysis
My next step was that I used my Flexible Volume Profile to look at how the volumes were distributed yesterday.The heaviest volumes were in the rotation area, and the heaviest volume peak (where most of the trades got placed) was around 76.38.
This is where the buyers placed most of their longs. This is a support they will want to defend.
So, if the price makes a pullback to this area I think that those buyers will be defending their longs and they will start aggressive buying again to push the price upwards again.

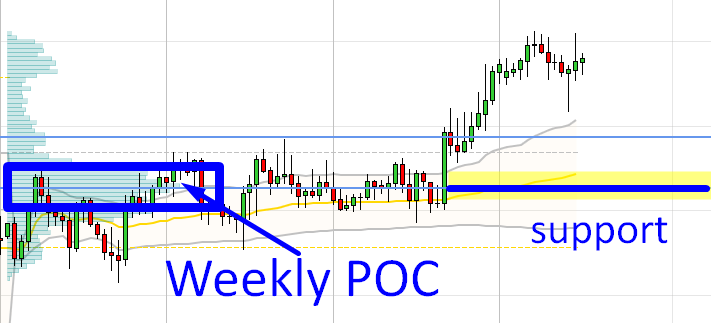
Weekly POC
A nice addition to all that is that this support is also a Weekly POC (Point Of Control). This means that the heaviest volumes were traded at this price level this week!You can see that on a 60 Minute chart with a Weekly Volume Profile below:

Volume Cluster at 76.56
As the price was moving upwards, more buyers were jumping in to make money on that up-move.Most of them jumped in around 76.56. You can see that on the Flexible Volume Profile – there is a significant volume cluster around the 76.56 area.
When the price makes it back to this area again, it is pretty likely that those buyers will want to defend their longs which they placed in that Volume Cluster (76.56 area).
In order to do that they will need to start buying again – aggressive buying! This should drive the price upwards again and this is what makes this level a strong support.
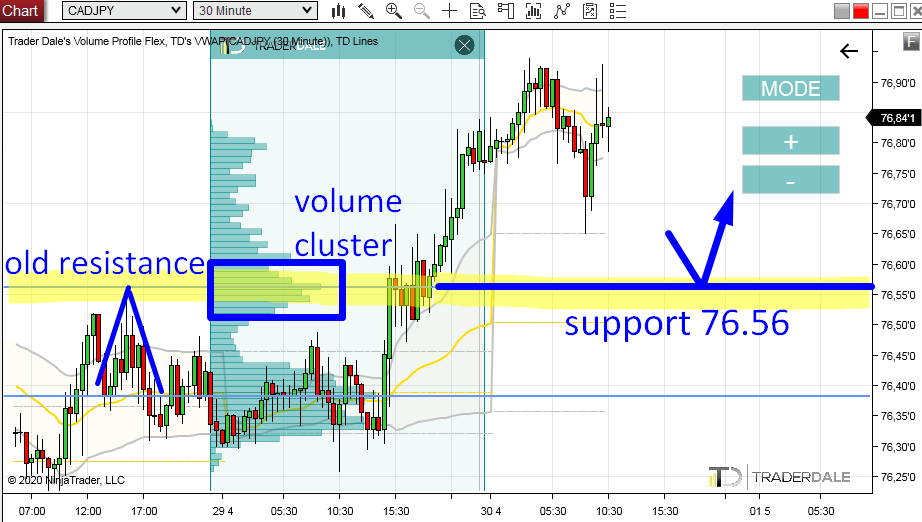
Resistance → Support
There is also one nice confluence to the Volume Cluster. If you look at the picture above, you can see that the 76.56 level also worked as a resistance in the past. The price got rejected there aggressively.The price went through this resistance yesterday, and it turned into a support. This is an old but pretty effective Price Action setup which I really like to see in a combination with the Volume Cluster – like in this case.
You can learn more about this setup here:
Resistance → Support (Price Action Setup)
I hope you guys liked today’s analysis! Let me know what you think in the comments below.
Stay safe and happy trading!
-Dale
Stay safe and happy trading!
-Dale
- Get link
- X
- Other Apps
- Get link
- X
- Other Apps
Hey, thanks for the information. your posts are informative and useful.
ReplyDeleteI am regularly following your posts.
Dilip Buildcon Ltd