This article is a part of a three-part Beginners Guide to VWAP. Here are links to all three parts:
A good quality VWAP
It is very important to have a good quality VWAP indicator which has all the functions you need.The most important functions and features are:
- VWAP (and its Deviations) are calculated correctly (there are many VWAPs around which have the calculation wrong).
- VWAP is able to calculate the 1st and 2nd VWAP deviations.
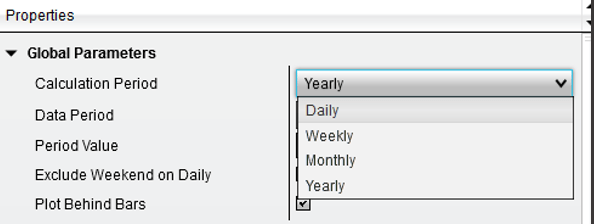
- You can switch between Daily/Weekly/Monthly and Yearly VWAP depending on your trading style (more about that later in the article).
- Prints a line where the previous session of VWAP and Deviations ended.
- You can use the VWAP for any trading instrument.
- You can use the VWAP with any type of chart and with any time frame.
Where to get a good VWAP?
You can get my VWAP indicator from my website, either as a part of The Elite pack (educational trading package) here: Dale’s Volume Profile Indicators and Education.
Or you can purchase it separately here: VWAP + VWAP Video Course.
My VWAP indicator has a lifetime license and you can use it on multiple computers.
Or you can purchase it separately here: VWAP + VWAP Video Course.
My VWAP indicator has a lifetime license and you can use it on multiple computers.
Setting up your VWAP
With my VWAP indicator, you can choose between different calculation periods. This is especially useful because you can tailor the VWAP to fit exactly your needs.You can can use those VWAP calculation periods: Daily, Weekly, Monthly, and Yearly.
Daily VWAP:
Is ideal for scalpers and day traders. It’s calculation starts anew
every day and it is very responsive to changes in price and volumes
which occur during the day.
Weekly VWAP: This one is good for day traders as well as for more long-term swing traders. It is not as responsive to quick changes as the Daily VWAP, but it points you to the most important S/R zones which occur throughout the week.
Monthly VWAP: This one is best used for swing trading. It does not respond to sudden changes quickly, but rather points you to the big levels which you would miss with the more responsive VWAP.
Yearly VWAP: Is best used for swing trading and investment planning (for example with stocks). This one gives you the strongest VWAP levels of the year. It only responds to the most significant changes in price and volume which occur throughout the year.
A cool thing my software does is that you can combine those VWAPs. This way you can for example watch Daily VWAP but you won’t miss an opportunity on a Weekly VWAP.
You can combine them in one chart or in multiple charts. I personally prefer more charts – I will show you that below.

Intraday trading workspace
In my intraday trading workspace I use two VWAP charts.
The upper chart is a 60 Minute chart which shows the Weekly VWAP (= every week a new VWAP and Deviations start to calculate). I use this to see the bigger picture.
The lower chart on left is a 30 Minute chart with a Daily VWAP (= every day a new VWAP and Deviations start to calculate).
This way I can keep track of both VWAPs – Weekly and Daily. This gives me the full picture which I need to see in my intraday trading.
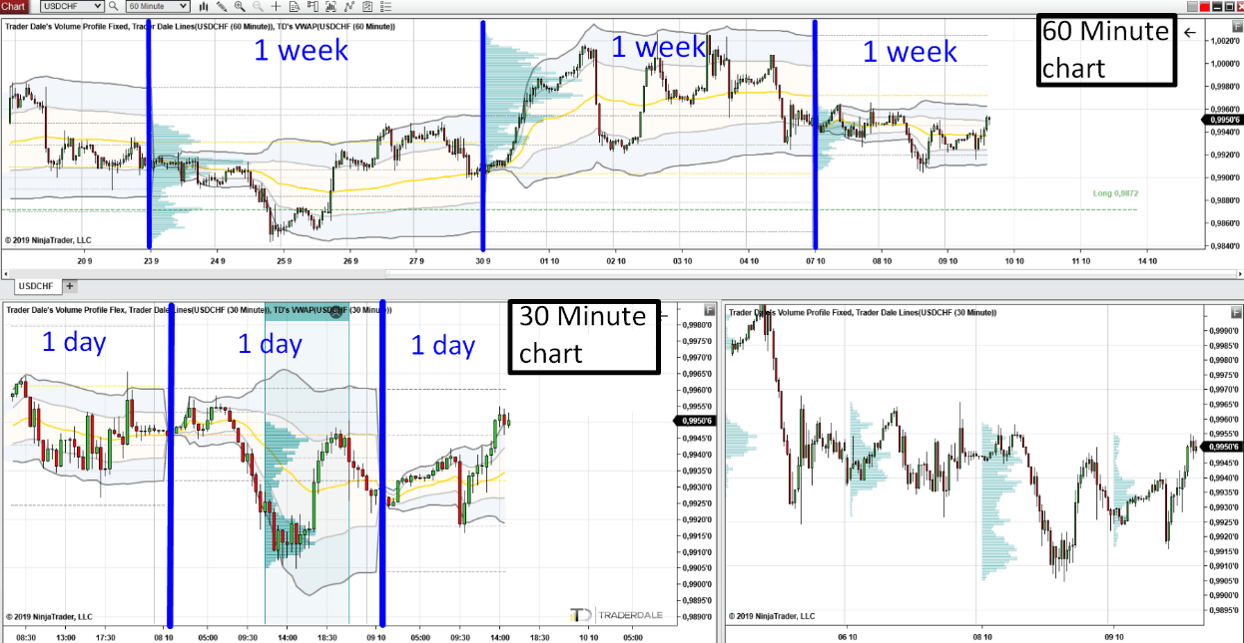
As you have probably noticed, I also have Volume Profile indicators in those charts. The upper chart is a Weekly Volume Profile (gets printed every week), and the lower left chart uses a Flexible Volume Profile.
This way, I can clearly see the confluences of VWAP and Volume Profile. I talked more about those confluences in my previous VWAP article here:
Beginners Guide to VWAP Part 2: VWAP Trading Setups
This way, I can clearly see the confluences of VWAP and Volume Profile. I talked more about those confluences in my previous VWAP article here:
Beginners Guide to VWAP Part 2: VWAP Trading Setups
Swing trading workspace
My swing trading workspace is simple. I prefer to use only the Yearly VWAP (with Daily chart) which points me to the most important S/R areas that form during the whole year.It looks like this:
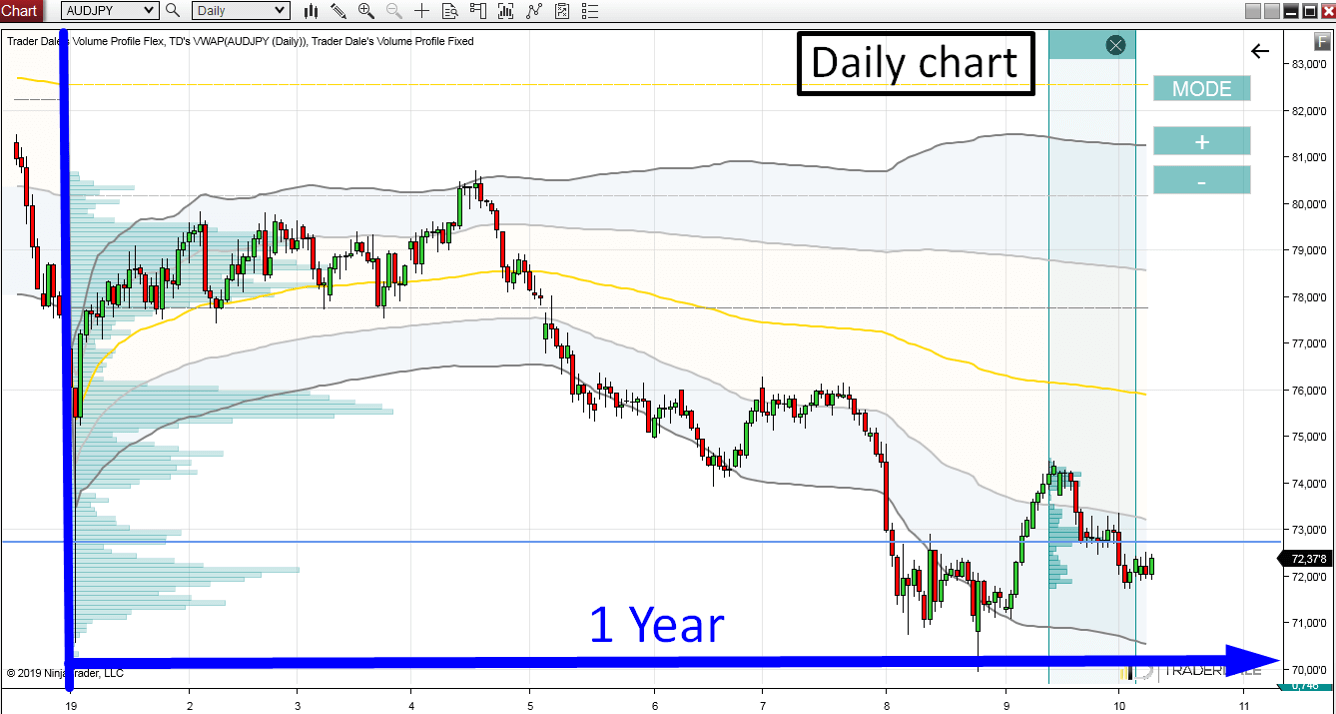
I also have Volume Profile in this chart. I use Yearly Volume Profile (gets printed every year) and also a Flexible Volume Profile which I can move around the chart and look into specific areas to see how volumes were distributed there.
BONUS
Here is a recording of a VWAP webinar I had recently. Enjoy!
Here are important and interesting questions I got during the webinar:
VWAP Webinar Q/A
VWAP Webinar Q/A
I hope you liked this VWAP series and that you learned something new!
Stay safe and happy trading,
-Dale
Stay safe and happy trading,
-Dale
- Get link
- X
- Other Apps
- Get link
- X
- Other Apps
Comments
Post a Comment