This article is a part of a three-part Beginners Guide to VWAP. Here are links to all three parts:
In this article I am going to to break down to you my two favorite VWAP setups.
You can use those setups on any trading instrument you want, and also on any time frame you want. I prefer to use 60 Minute and 30 Minute time frame.
When the market is in a rotation, then those 1st Deviations work as support and resistance zones.
Apart from my other trading strategies, I consider those Deviations strong support and resistance zones even after they get tested for the first time. So no matter how many times they get hit, they should always represent supports and resistances.
In the previous VWAP article I said that VWAP works like a magnet. For this reason, you can use the VWAP line as Take Profit.
You can also use fixed Take Profit – for example, 20 pip profit (for intraday trading).
The picture below shows a short trade scenario on EUR/USD; 60 Minute chart; Weekly VWAP:
- Beginners Guide to VWAP Part 1: What is VWAP
- Beginners Guide to VWAP Part 2: VWAP Trading Setups
- Coming soon…
In this article I am going to to break down to you my two favorite VWAP setups.
You can use those setups on any trading instrument you want, and also on any time frame you want. I prefer to use 60 Minute and 30 Minute time frame.
Setup #1: VWAP Rotation Setup
I trade this setup when the price is in a rotation. To identify a rotation I use VWAP 1st Deviations – those are the grey lines. If they both move horizontally (sideways), then there is a rotation.When the market is in a rotation, then those 1st Deviations work as support and resistance zones.
Apart from my other trading strategies, I consider those Deviations strong support and resistance zones even after they get tested for the first time. So no matter how many times they get hit, they should always represent supports and resistances.
Long trade scenario:
When a price is below VWAP and hits the 1st Deviation from above, then it is a signal to enter a long position. After your entry, the price should head back into the center of the rotation – towards the yellow VWAP line.Short trade scenario:
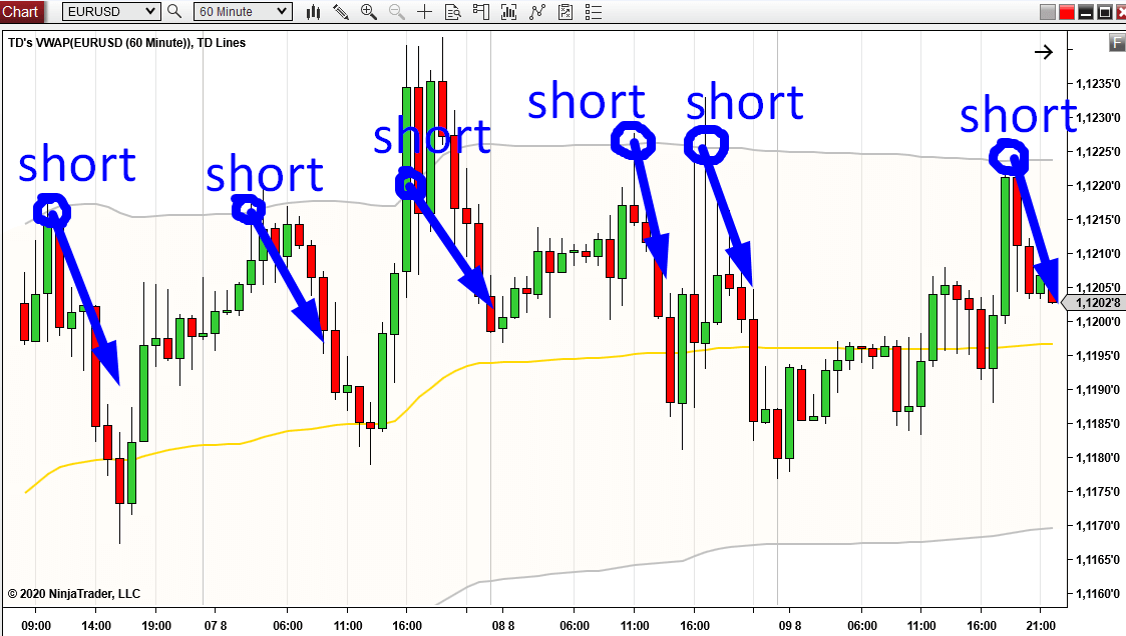
The price is above VWAP and it hits the upper 1st Deviation from below. This is a signal for a short trade entry. The price should react to the resistance and head back into the rotation – towards the VWAP line.In the previous VWAP article I said that VWAP works like a magnet. For this reason, you can use the VWAP line as Take Profit.
You can also use fixed Take Profit – for example, 20 pip profit (for intraday trading).
The picture below shows a short trade scenario on EUR/USD; 60 Minute chart; Weekly VWAP:
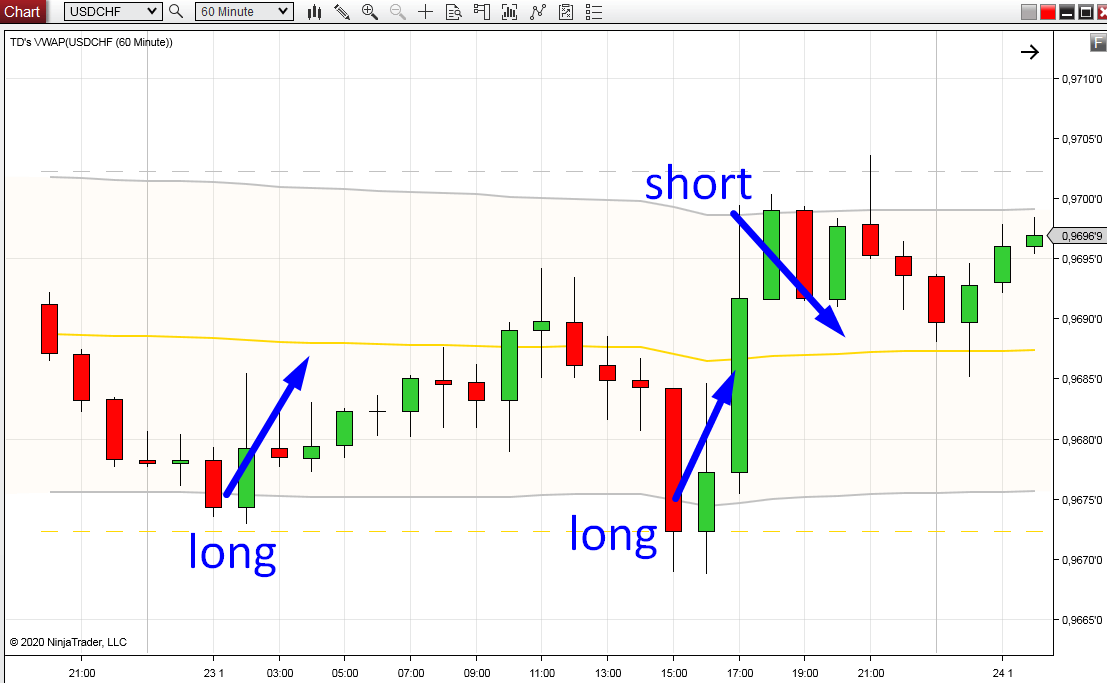
Another example of the VWAP Rotation strategy shows two long trade opportunities and one short trade opportunity.
In all three cases the yellow VWAP line would work as a nice place for a Take Profit.
The chart below shows USD/CHF; 60 Minute chart; Weekly VWAP:
In all three cases the yellow VWAP line would work as a nice place for a Take Profit.
The chart below shows USD/CHF; 60 Minute chart; Weekly VWAP:

Setup #2: VWAP Trend Setup
As the name of this setup tells you, you should look for this setup when there is a trend.So, the first thing to do is identify a trend. I prefer to do that using 1st Deviations of VWAP (grey lines). If one or both of them starts to move vertically (upwards or downwards), then it means the the price and volumes are shifting and that there is a trend.
Long trade scenario:
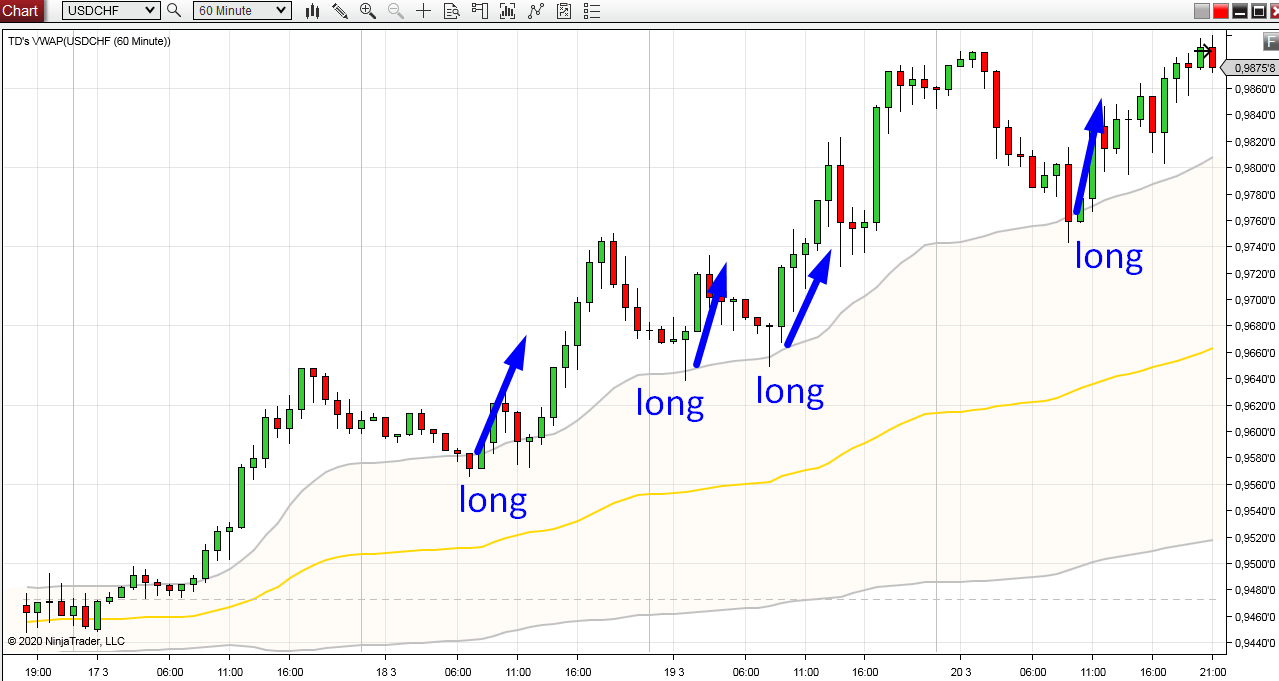
When there is an uptrend (the 1st deviation is moving upwards) then I want to see the price move above the 1st deviation.This 1st deviation should work as a support, so when the price hits it from above, then it is a signal to enter a long trade.
I like the first test of the support the most, but I don’t mind trading all the tests (going long every time the price hits the 1st Deviation from above).
Below is USD/CHF; 60 Minute chart; Weekly VWAP:
Short trade scenario:
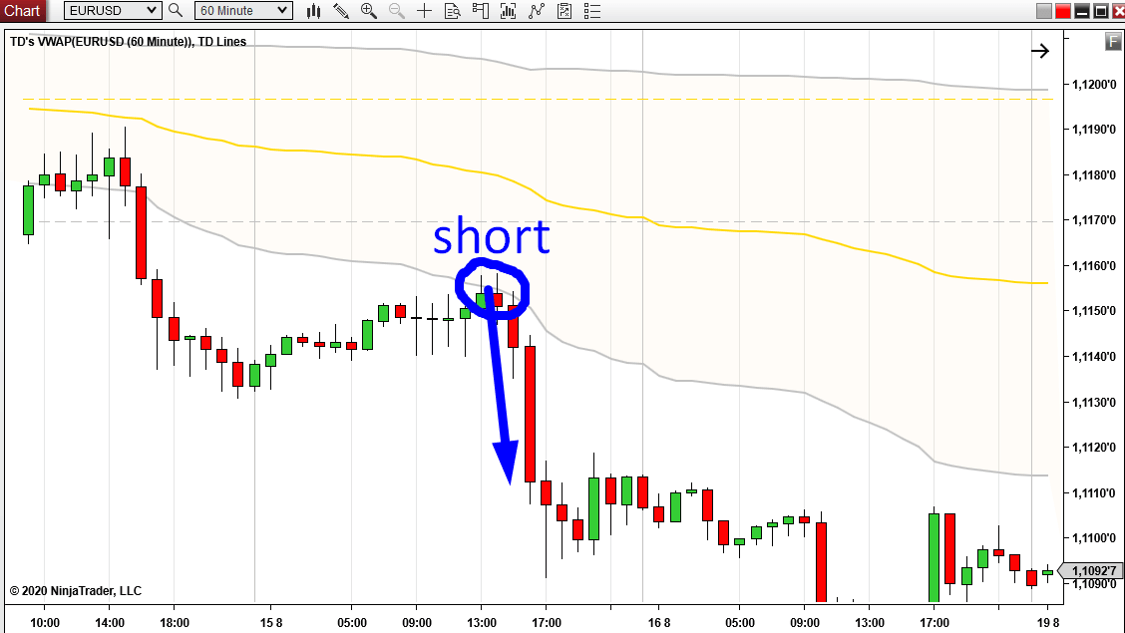
When there is a downtrend (the 1st Deviation is heading downwards) then I want to see the price moving below the 1st Deviation.When there is a pullback to the 1st Deviation, then it is a signal for a short trade.
Every time the price hits the 1st Deviation from below it is a signal to go short. You can do this until the trend stops and a rotation starts.
Then it is time for the Rotation setup again…
Below is the VWAP Trend setup on EUR/USD; 60 Minute chart; Weekly VWAP:
VWAP + Volume Profile
You will get the best results when you combine VWAP trading setups with Volume Profile trading setups.The way to do this is to find a price level where you get a trade entry signal from VWAP (from either of the two strategies I showed you) and also an entry signal from some of the Volume Profile setups.
Both VWAP and Volume Profile need to point you to the same trading level.
In order to do this you need to learn the Volume Profile setups. You can learn them here:
Volume Profile Trading Setups
Here are some examples of how to combine VWAP and Volume Profile:
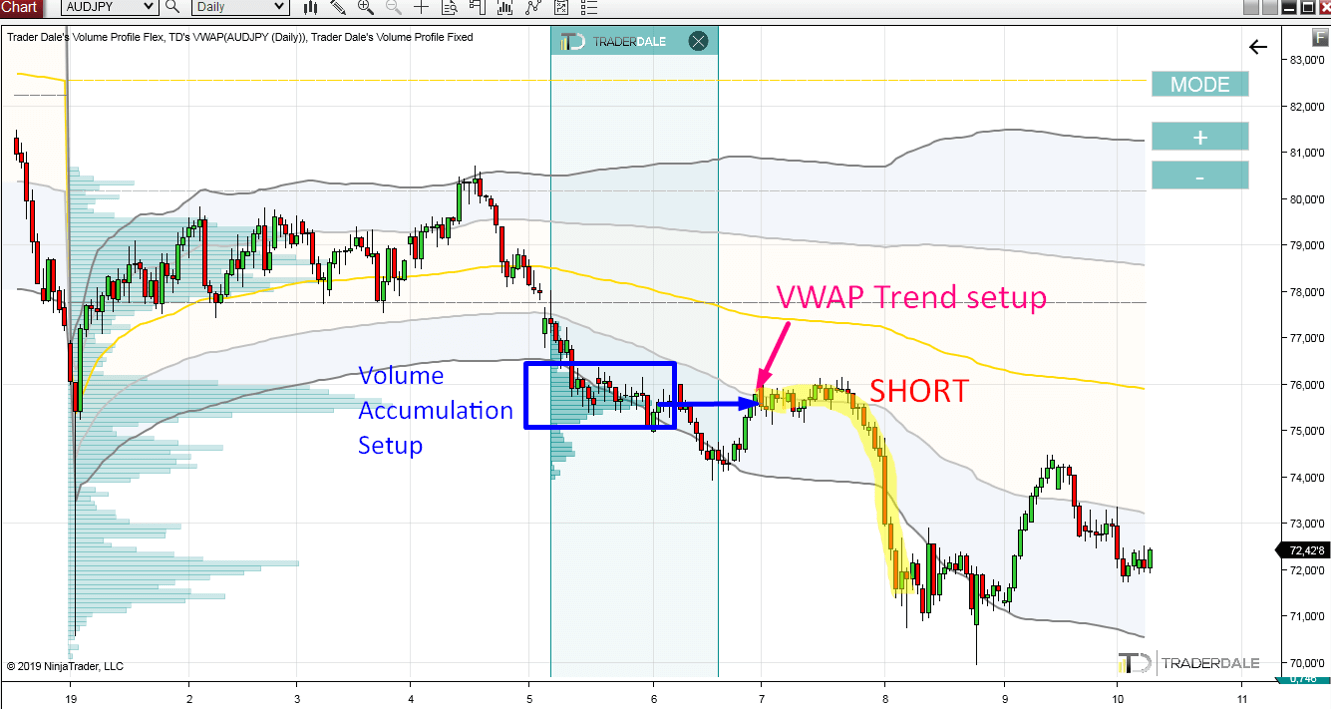
Example #1
The first example is on a Daily chart of AUD/JPY. Here I am using a Yearly VWAP, which means that every Year a new VWAP(+ Deviations) are calculated anew.VWAP shows a short entry based on the VWAP Trend Setup. There is also a Volume Profile setup called the Volume Accumulation Setup. Both these setups point to the same short level:
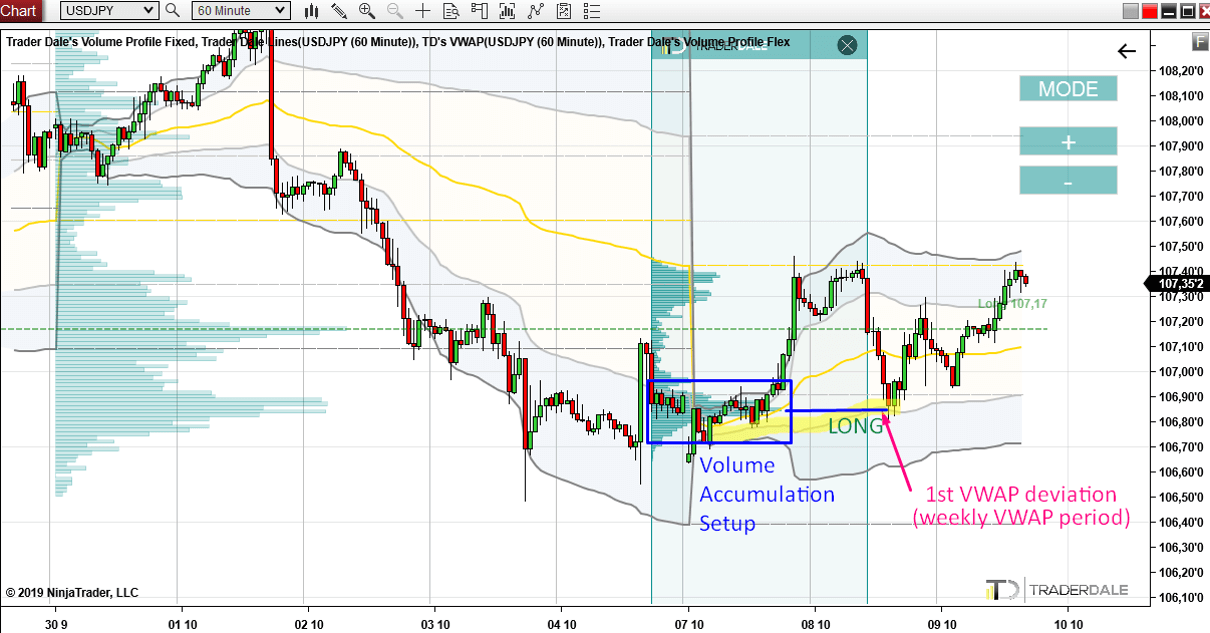
Example #2:
The picture below shows a 60 Minute chart of the USD/JPY. Here I use the Weekly VWAP (every new week a new VWAP + Deviations start calculating anew).There is the same Volume Profile setup as in the previous example (the Volume Accumulation setup). Only this time it is a long trade scenario.
As you can see, the heaviest volume area points to the same place as the 1st VWAP deviation. This makes it a confluence of two trading signals – both pointing to a nice long level.
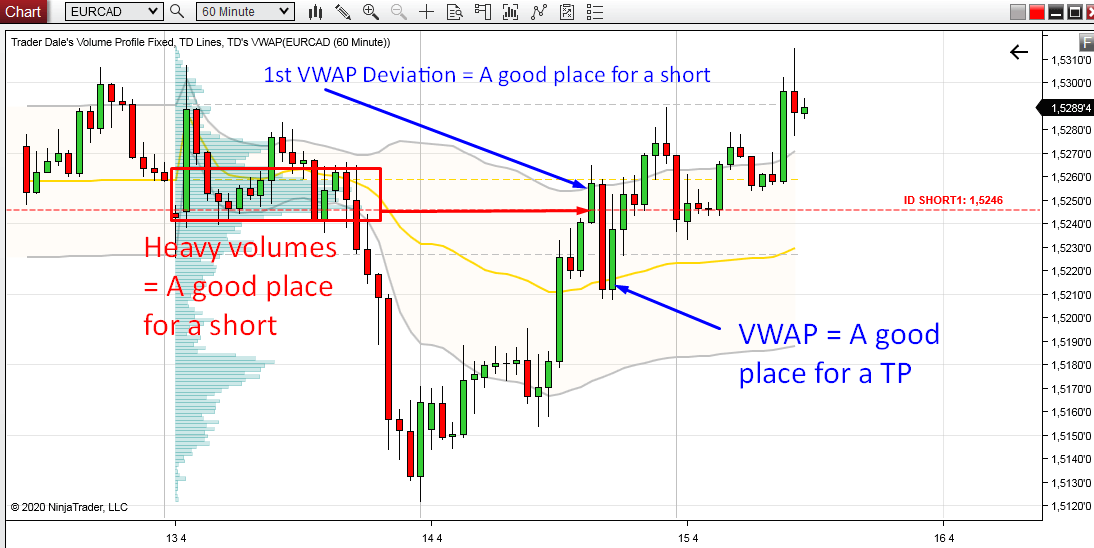
Example #3:
The picture below shows a 60 Minute chart of the EUR/CAD.There is a significant volume zone (marked in red rectangle). This zone marks a strong resistance level.
There is also the VWAP Rotation setup just a bit above this volume-based level.
Again, Volume Profile and VWAP Deviations nicely confirm each other and mark a strong resistance area.
A good place for a Take Profit is the yellow VWAP line.
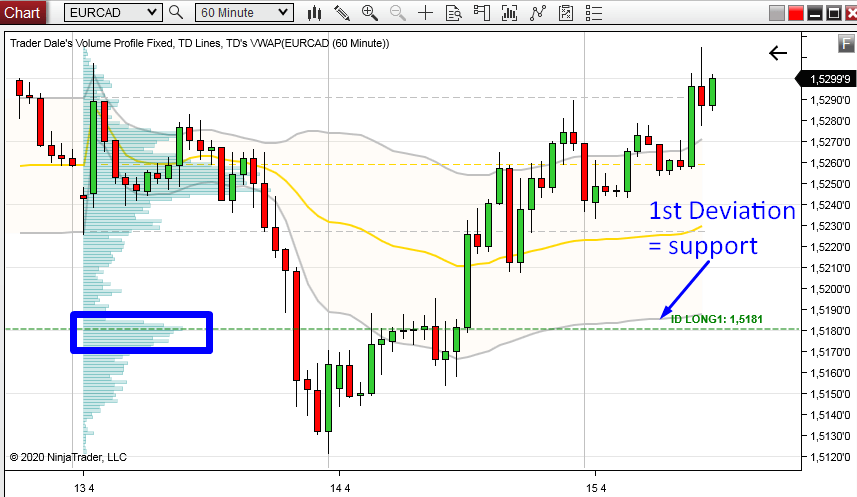
Example #4:
The last example is on the same chart as the previous example. This time, there is a volume-based support (blue rectangle) and the VWAP Trend setup.The price has not yet made a pullback to this zone so this level is still active and waiting to be triggered.
Want to learn more?
Would you like to learn
more of my trading setups, see more examples, learn more about trading
with Volume Profile, VWAP, Price Action and trade with me every day?
Then check my trading education packages here:
Then check my trading education packages here:
- Get link
- X
- Other Apps
- Get link
- X
- Other Apps
Comments
Post a Comment