Gold hit a major long-term resistance
which I wrote about a month ago. Despite all the uncertainty around the
world (which should actually help gold to strengthen) there was a nice reaction to this resistance and a sharp sell-off.
You can read the reasoning behind the resistance here:
A MAJOR Resistance On Gold
To me, it appears that the selling on Gold has just started and it might continue in the future.
Below is a Daily chart of Gold with the resistance I predicted and the reaction.
A MAJOR Resistance On Gold
To me, it appears that the selling on Gold has just started and it might continue in the future.
Below is a Daily chart of Gold with the resistance I predicted and the reaction.

What happened around 1665
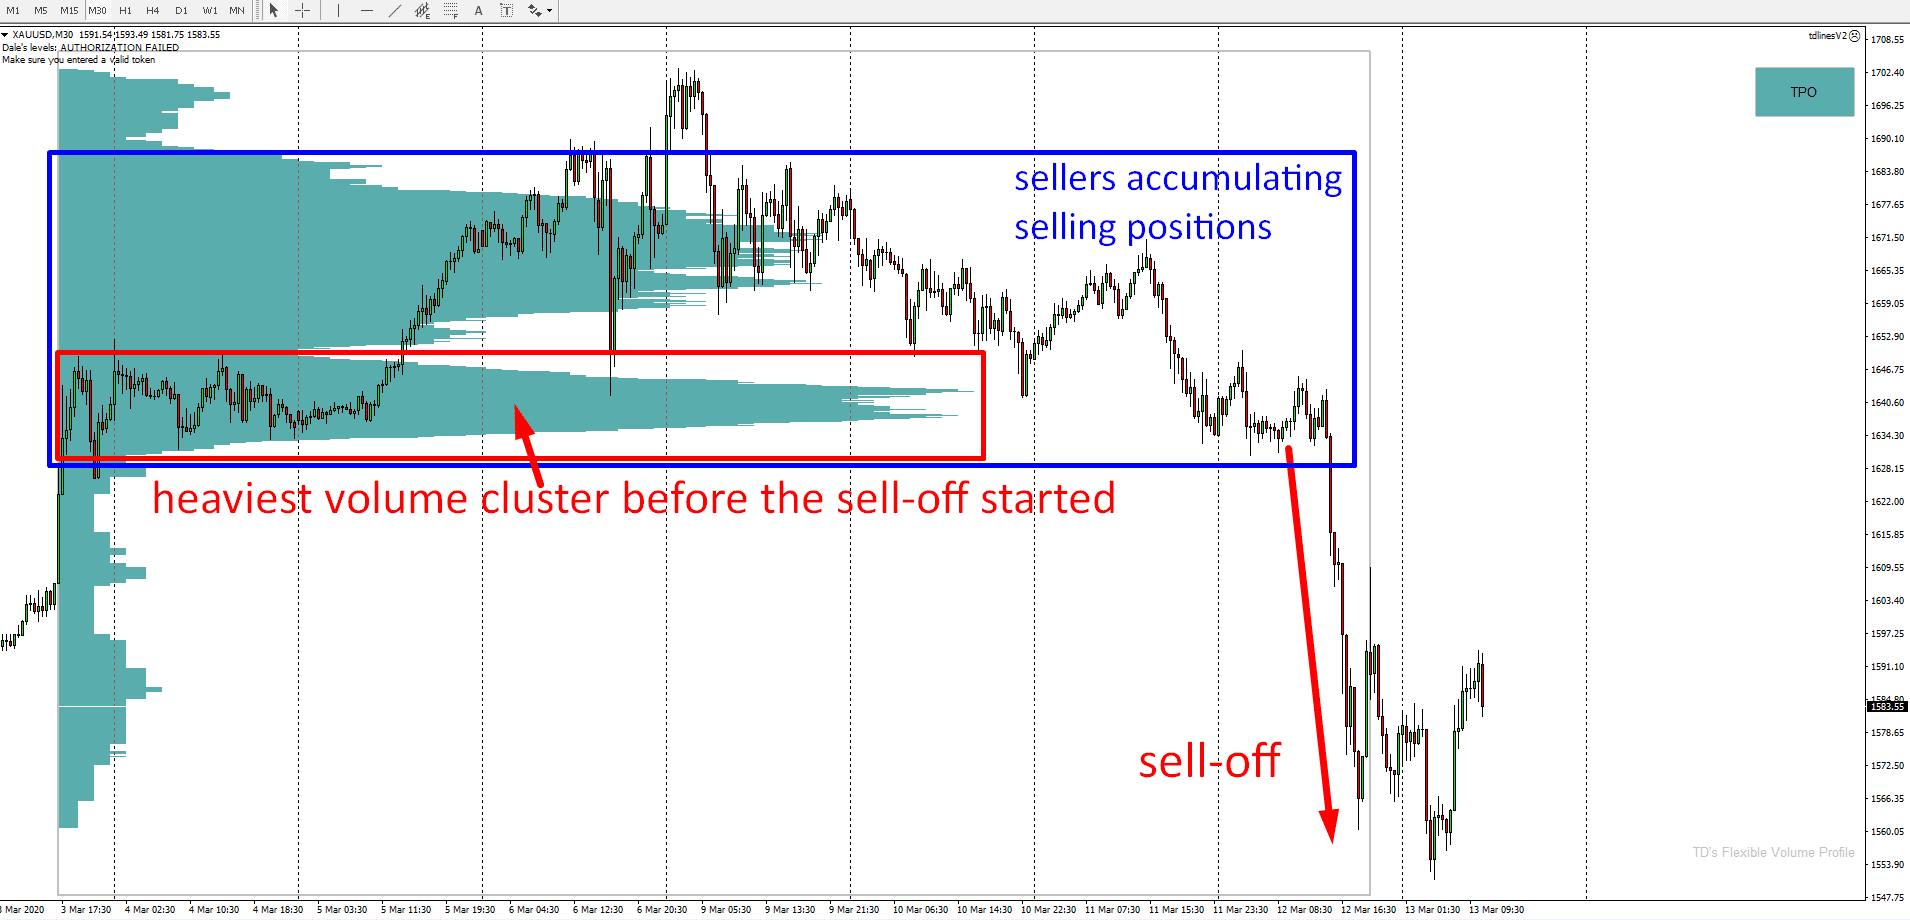
Let’s now zoom in a bit and let’s have a look at what actually happened around the major long-term resistance (1665). I will explain on a 30 Minute chart.First, the price went upwards and hit the resistance. Then there was a rotation around the resistance and then an aggressive sell-off started yesterday.
If you look into the volume distribution (picture below) within this whole area you can see that there were heavy volumes accumulated in this rotation. There were two significant volume zones. I marked the stronger one in the picture below.
What happened here was most likely this: Buyers were pushing price upwards, then when the price hit the long-term resistance around 1665 sellers started actively accumulating selling positions (that’s the heavy volume areas we see below). After a couple of days the sellers entered their selling positions and then they started aggressive selling to start the sell-off which occurred yesterday.
Resistance around 1636
Now when you know the bigger context I would like to talk about a resistance which formed just yesterday around 1636.There are several things I like about this resistance and I will cover them one by one:
First, there was a tight rotation with quite heavy volumes accumulated around 1636. Then strong sell-off started from there. This indicates that sellers were adding to their selling positions there and from this place they started their aggressive sell-off. When the price hits this area again those sellers are likely to become active again and to push the price downwards again.
Another thing I like about this 1636 area is that the heavy volume cluster (from the picture above) was also at this level. This means that around 1636 the sellers from the last couple of days accumulated most of their selling positions there.
The third thing is that this 1636 area worked as a support in the past. The price bounced twice off this level. When the price went through this support yesterday, it then became a resistance. More about this setup here:
Support→Resistance Price Action Setup
So, we have three nice confluences that all confirm this resistance. You can see it all in the picture below (Gold; 30 Minute chart):

How to trade this?
There are two ways you could consider trading this. First, as an intraday trade where you would enter the trade with a tight Stop Loss and then quit it relatively soon.Or if you haven’t managed to get into a long-term short trade around the 1665, then this might be your second chance to enter such position from a pretty good level. This way you wouldn’t be chasing the market but you would wait until it comes back to you – back to a price where it actually makes sense to press the SELL button.
I hope you guys liked this article. Let me know what you think in the comments below!
Happy trading!
-Dale
Happy trading!
-Dale
- Get link
- X
- Other Apps
- Get link
- X
- Other Apps
Comments
Post a Comment