The current market development is pretty crazy. The average daily volatility has risen dramatically and there are strong trends everywhere.
In today’s article, I would like to show you how to use VWAP indicator to trade in trends like that.
For this reason, when there is a trend we need pullbacks. Now the big question is this: Pullbacks to where? There are two options for this and you can combine them and use them together.
First option is pullbacks to significant Volume Clusters which you identify using the Volume Profile tool. The second option is to use VWAP and it’s deviations.
You will usually have more trading opportunities when you trade pullbacks to the VWAP deviations then to Volume Clusters. So today, I will focus on pullbacks to the VWAP deviations.
When you see a downtrend then you need the price to move below the 1st VWAP deviation. That’s the grey indicator line. This line works as a Resistance. Whenever the price hits it from below, you can expect a selling reaction.
So, when there is a trend the easiest setup is just to trade pullbacks to this 1st VWAP deviation. Like in the picture below.
EUR/USD, 60 Minute chart; Weekly VWAP:
In today’s article, I would like to show you how to use VWAP indicator to trade in trends like that.
Let’s talk pullbacks!
When there is a trend then in my experience it is best to trade pullbacks. This means that you don’t just blindly enter a long or a short position but you wait for the pullback. Strong and “healthy” trends need to make pullbacks. If the price just shoots one way then there is no time to enter big trading positions (which the big guys need!).For this reason, when there is a trend we need pullbacks. Now the big question is this: Pullbacks to where? There are two options for this and you can combine them and use them together.
First option is pullbacks to significant Volume Clusters which you identify using the Volume Profile tool. The second option is to use VWAP and it’s deviations.
You will usually have more trading opportunities when you trade pullbacks to the VWAP deviations then to Volume Clusters. So today, I will focus on pullbacks to the VWAP deviations.
Pullbacks to VWAP 1st Deviation
What you want to see first is a trend. In the two examples which I have for you today, there are strong downtrends. So, let’s talk about the downtrend scenario, okay?When you see a downtrend then you need the price to move below the 1st VWAP deviation. That’s the grey indicator line. This line works as a Resistance. Whenever the price hits it from below, you can expect a selling reaction.
So, when there is a trend the easiest setup is just to trade pullbacks to this 1st VWAP deviation. Like in the picture below.
EUR/USD, 60 Minute chart; Weekly VWAP:
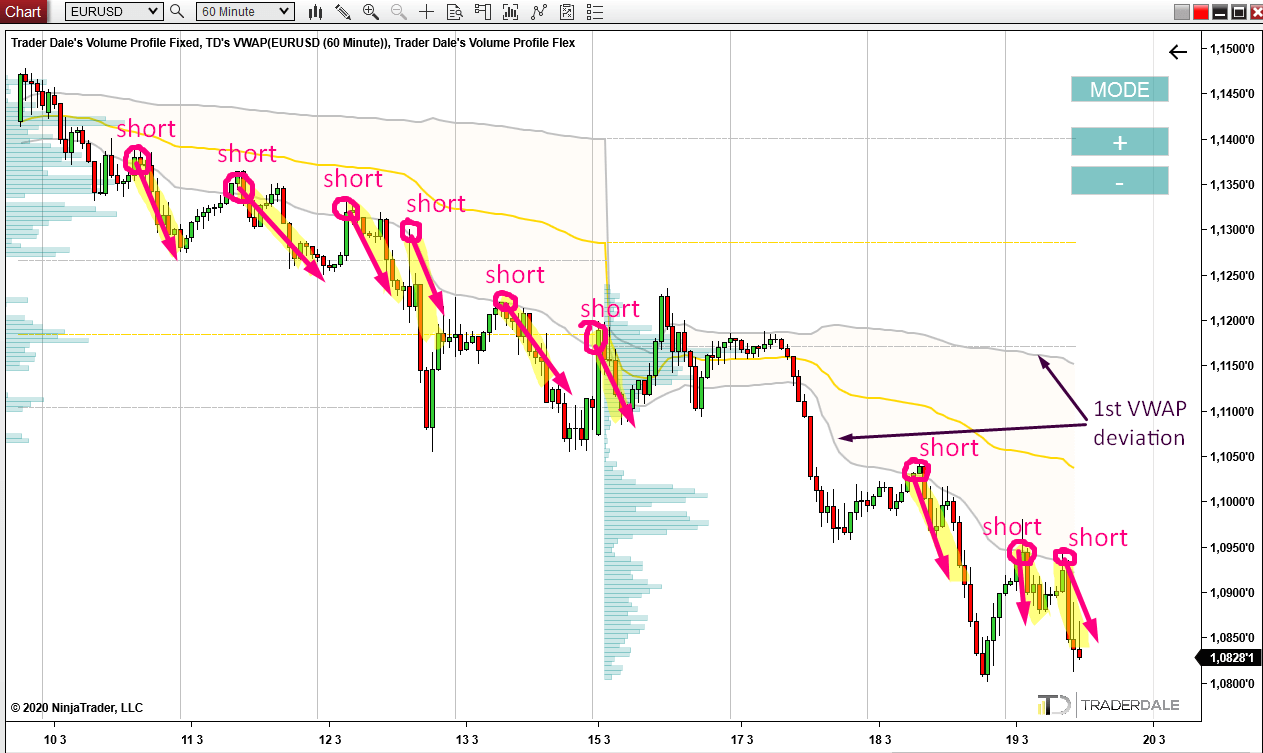
As you can
see in the picture above, there were nine nice short trade
opportunities. All based just on this simple pullback strategy!
VWAP + Volume Profile combination
Another way how to trade pullbacks is to combine VWAP with Volume Profile. I talked about this also in my yesterday’s article here:
How To Get The Best From VWAP
With this method you want to trade pullbacks to places where 1st VWAP deviation meets heavy Volume Cluster. This combination gives you the luxury of one trading strategy confirming the other one. When there is a trend and you really want to get in, then you won’t always have this luxury of having this double confirmation. But sometimes you do and those trades are REALLY worth it!
If you look at the picture below you can see that in this case there were not only pullbacks to the 1st VWAP deviation, but those places were also supported by heavy Volume Clusters. This is the kind of confirmation I am talking about!
AUD/USD, 60 Minute chart; Weekly VWAP:

Adjust to high volatility
With trading conditions like these (high volatility, news coming up often, markets getting crazy,…) you absolutely need to adjust to such severe trading conditions.What does that mean? The most crucial adjustments are these: First, use wider Stop Loss and Profit Target. Way wider! At least double the usual.
Second, lower volumes of your trading positions. There is no bravery in trading big money in crazy situation like this! Don’t feel bad for trading with smaller positions. I am talking for example 3-4 times smaller positions than usual. So if your standard trade size is 1 lot, then now 0.25 should be just fine!
Third (this is REALLY important!), close all your trades before the Weekend! In situation like this you can expect big opening gaps on Monday open. Being caught in a big gap with a trade open could mean blowing up your trading account!
I hope you guys liked this article. Let me know what you think in the comments below!
Stay safe and happy trading!
-Dale
Stay safe and happy trading!
-Dale
- Get link
- X
- Other Apps
- Get link
- X
- Other Apps
Comments
Post a Comment