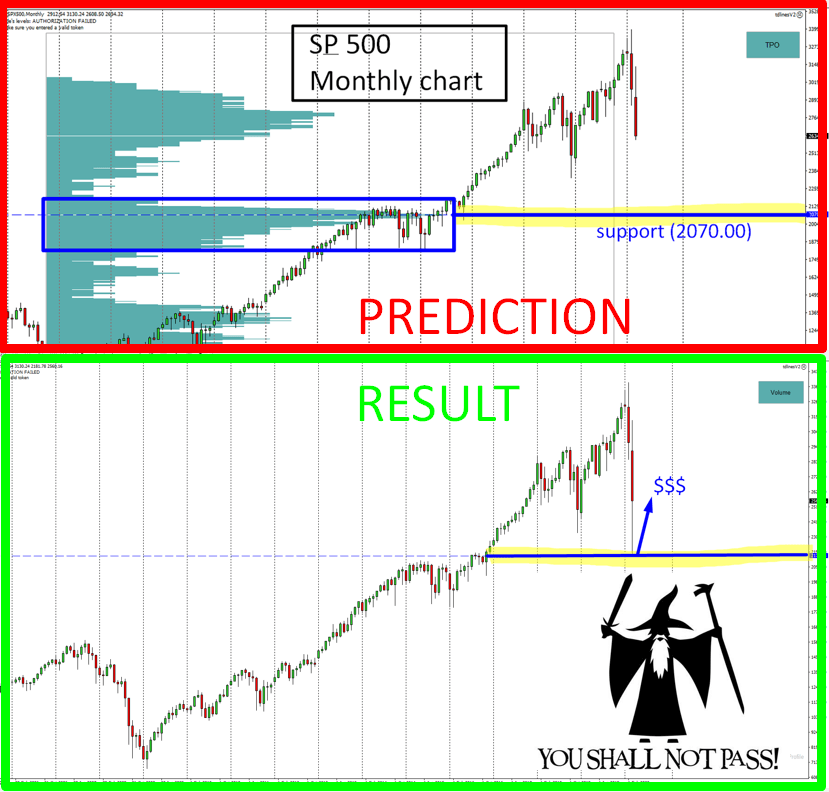
It seems that the S&P 500 has finally found it’s bottom and there are buyers pushing it upwards again!
BTW. I predicted almost the exact spot for this and posted it here two weeks ago. You can check it out here:
Dale’s S&P 500 prediction
Anyways, one picture tells it all:
Dale’s S&P 500 prediction
Anyways, one picture tells it all:
The Special Webinar -50% Sale ends TODAY – Friday 27th. You can get it here:
Elite Pack -50% SALE
Elite Pack -50% SALE
What happened before the price turned up?
Today, I don’t really want to talk about the big picture though. I want to look at lower time frames. What I am interested in is how the volumes were distributed recently in the strong rejection of the lower prices. This is basically the last two weeks.You know, before the big guys turned the price upwards again, they needed to enter their longs. They needed to buy cheap in order to make money when they pushed the price upwards again.
When there is a sharp reversal of prices like now, there usually is a volume accumulation area before that. Volume accumulation area = that’s where the big guys entered their longs again.
If you look at the picture below (ES; 60 Minute chart, that’s S&P 500 futures) then you can see that there were pretty nice and massive volumes traded (accumulated) there. The absolute volume peak was around 2420-2430.
This is the place the aggressive buyers entered most of their longs! Who sold them? All those guys who thought the US economy is done for and that this is THE END! Those guys sold them 🙂
Who was buying? Big institutions and the clever guys like us who use the Volume profile!
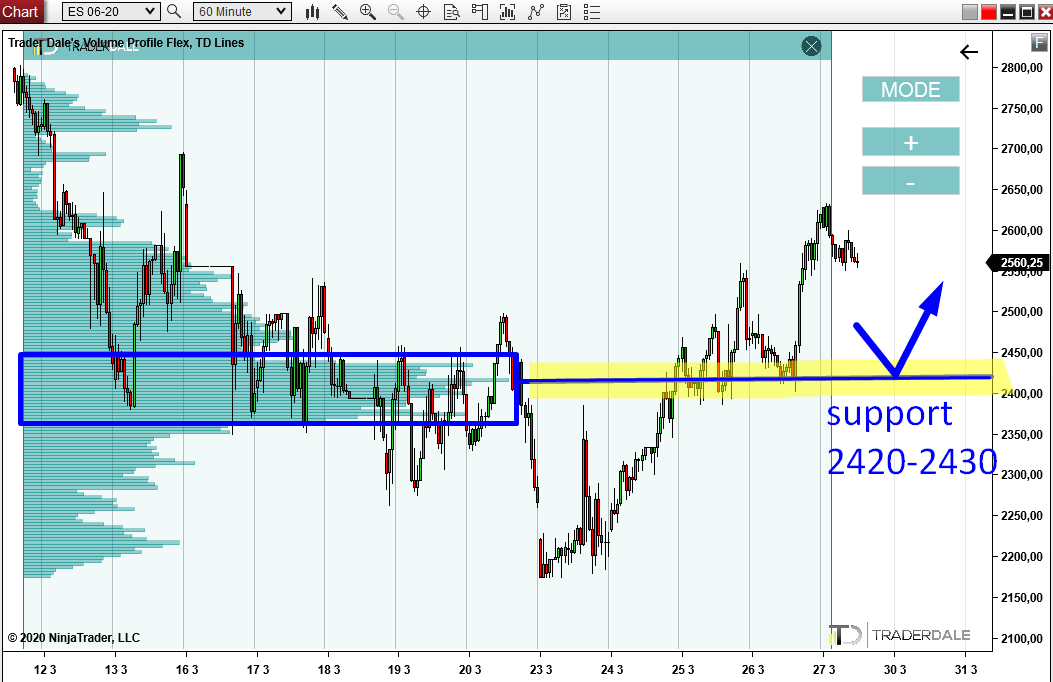
2420-2430 support
What now? Now this heavy volume area should work as a strong support. Why? Because those buyers who entered their longs there don’t want to see their longs in red numbers! They want the price to go up and shoot through the roof!So, if the price makes a pullback to this area, those buyers will be defending their positions. They will be buying aggressively and the will be trying to push the price upwards again.
That’s what is most likely going to happen (if there is the pullback). For this reason, the 2420-2430 area (where most of the volumes got traded) should work as a strong support.
The pandemic is not over yet!
However, the corona virus war is not over yet. The first shock is behind us (it is the shocks that cause those crazy big sell-offs) but the situation could get worse. It is hard to tell if the pandemic has reached it’s peak or not but if it somehow manages to spread on a larger scale, then this big dip on the stocks may not be the last one we see. So be careful. Don’t go too crazy with your longs! And very importantly – don’t leave your short-term trading positions opened through the weekend! In a situation like this a Monday opening gap could be deadly!
I hope you guys liked this article. Let me know what you think in the comments below!
Have a GREAT weekend, stay safe and happy trading!
-Dale
Have a GREAT weekend, stay safe and happy trading!
-Dale
- Get link
- X
- Other Apps
- Get link
- X
- Other Apps
ReplyDeleteHey, thanks for the information. your posts are informative and useful.
Hercules Hoists Ltd
Thanks for sharing valuable information
ReplyDeleteShriram Transport Finance Co. Ltd
Oberoi Realty Ltd