Today, I am going to do an intraday analysis of EUR/CAD. I will use Volume Profile, VWAP and Price Action to do that.
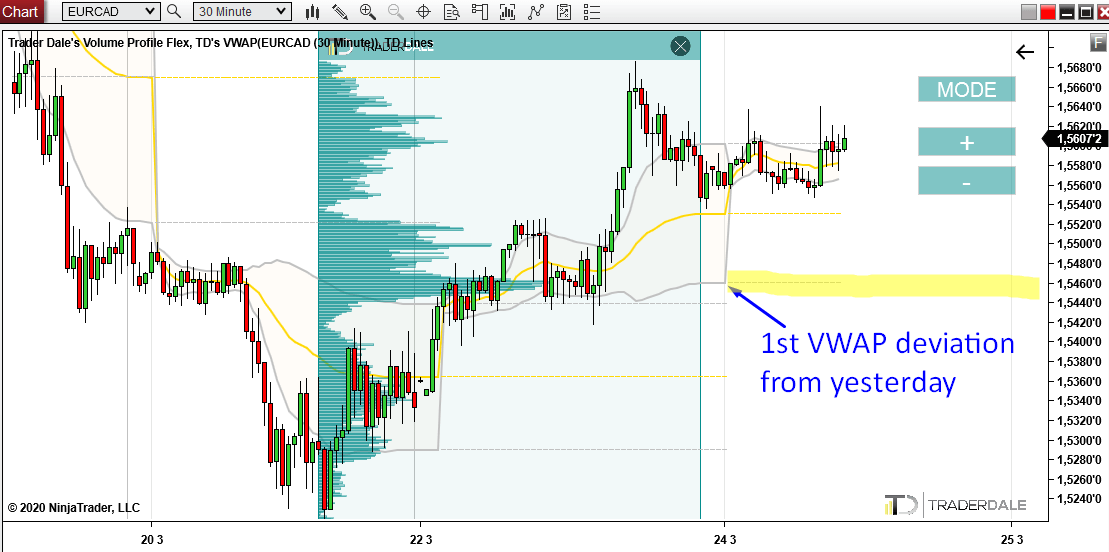
If you look closely, then you will see that the grey line from yesterday (1st deviation of VWAP) ended it’s calculation at 1.5462. This is exactly the same level as the Volume Profile pointed us to!
This makes it a nice confluence of two signals. Volume Profile + 1st VWAP deviation.
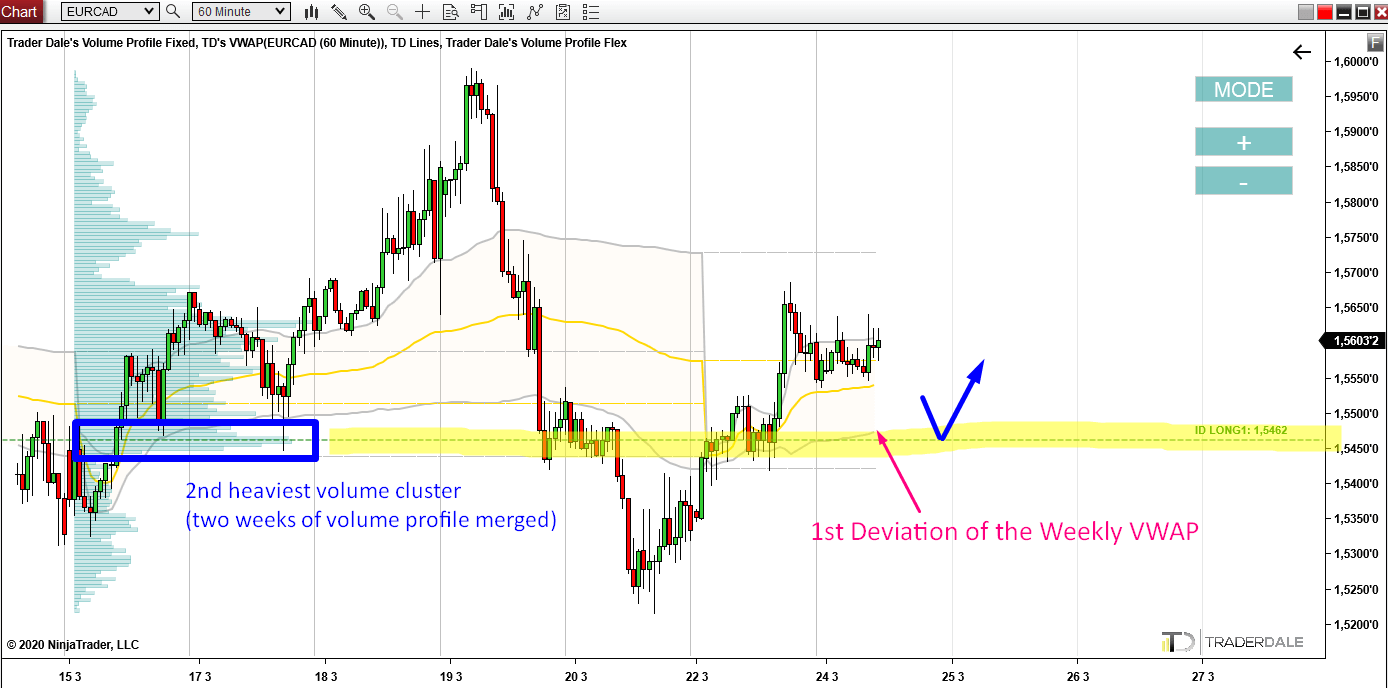
Since it is only Tuesday morning, I merged two Weekly Volume Profiles together (to get more data). The one from the previous week and the one from this week (this one was showing only volumes from yesterday and today).
What those two merged profiles showed me is a significant volume area at our level (1.5462). It is especially important to me because this volume area is nicely visible from the weekly point of view (the bigger picture). It is in fact, the second strongest volume area in this whole period.
As a nice addition to this there is also the 1st deviation of the Weekly VWAP almost exactly at the level. Now, this deviation is till moving so we don’t know where it will be when the price makes it back to the 1.5462 support. But if the 1st deviation is close, then it will be another nice confluence to this level!
EUR/CAD; 60 Minute chart:
What you see below is my intraday trading workspace. It consists of three charts and it shows all the things I was talking about in this article. Everything on just one screen.
I am not saying it takes just a quick look and I immediately see strong trading levels. It takes some thinking to find them, but having a workspace like this makes things way easier!
You should be extra careful especially now when there is news coming up very often and the overall market volatility has risen dramatically.
What I want to show you is how you can use all those together to find strong confluences. What do I mean by a confluence? A confluence means a place where more signals from different trading indicators meet and point to a strong trading level.
*I talk more about it here:
Volume Profile webinar
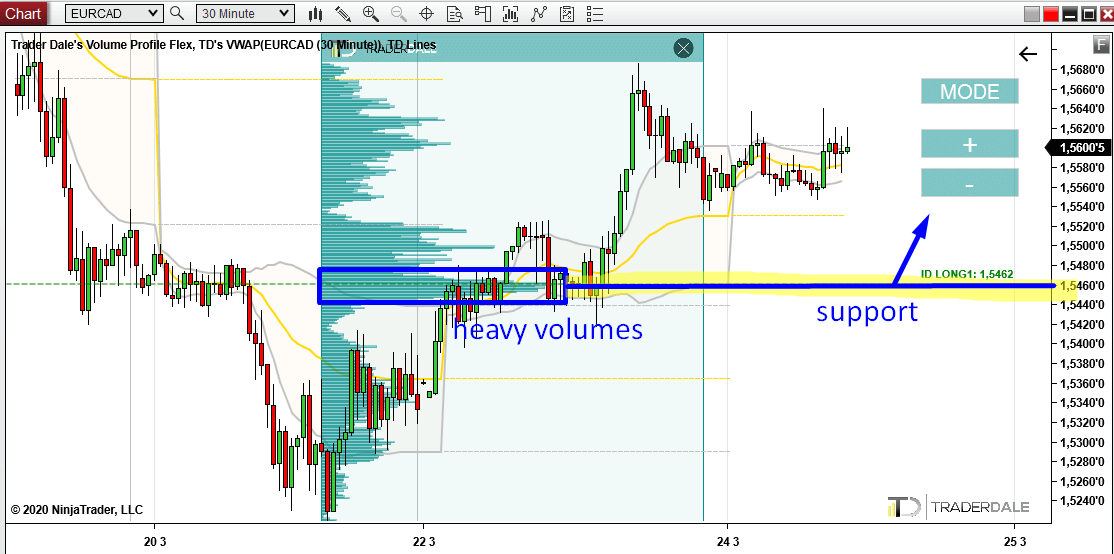
What I did was that I used my Volume Profile tool to see how the volumes were distributed there. As you can see in the picture below, there were heavy volumes created in the rotation. From this rotation a buying activity (an uptrend) started.
This tells me that buyers were entering their longs slowly and unnoticed in that rotation. When they were done with the volume accumulation, they started pushing the price aggressively upwards.
What is the most important place for those buyers? It is the place where they placed most of their positions. This is where the Volume Profile is the thickest – at 1.5462. This is a strong level they will most likely defend in the future (support).
Volume Accumulation Setup
The first thing I am going to talk about is a 30 Minute chart (EUR/CAD). What immediately caught my eye was a rotation from which a strong buying activity started. This is what I call the Volume Accumulation setup.*I talk more about it here:
Volume Profile webinar
What I did was that I used my Volume Profile tool to see how the volumes were distributed there. As you can see in the picture below, there were heavy volumes created in the rotation. From this rotation a buying activity (an uptrend) started.
This tells me that buyers were entering their longs slowly and unnoticed in that rotation. When they were done with the volume accumulation, they started pushing the price aggressively upwards.
What is the most important place for those buyers? It is the place where they placed most of their positions. This is where the Volume Profile is the thickest – at 1.5462. This is a strong level they will most likely defend in the future (support).
Daily VWAP
Below, you can see the same 30 minute EUR/CAD chart. This time I will focus on the VWAP. In this chart I am using a Daily VWAP. This means that every new day this indicator gets calculated anew.If you look closely, then you will see that the grey line from yesterday (1st deviation of VWAP) ended it’s calculation at 1.5462. This is exactly the same level as the Volume Profile pointed us to!
This makes it a nice confluence of two signals. Volume Profile + 1st VWAP deviation.
The Special Webinar -50% Sale ends this Friday 27th. You can get it here:
Elite Pack -50% SALE
Elite Pack -50% SALE
The big picture
There is more! Let’s now have a look at the 60 Minute chart of the same instrument. I use this chart to give me a bigger picture (overview) of the market. In this chart I use Weekly Volume Profile and Weekly VWAP. This means that every week a new Volume Profile will automatically get printed. Also a new VWAP will start it’s calculation every new week.Since it is only Tuesday morning, I merged two Weekly Volume Profiles together (to get more data). The one from the previous week and the one from this week (this one was showing only volumes from yesterday and today).
What those two merged profiles showed me is a significant volume area at our level (1.5462). It is especially important to me because this volume area is nicely visible from the weekly point of view (the bigger picture). It is in fact, the second strongest volume area in this whole period.
As a nice addition to this there is also the 1st deviation of the Weekly VWAP almost exactly at the level. Now, this deviation is till moving so we don’t know where it will be when the price makes it back to the 1.5462 support. But if the 1st deviation is close, then it will be another nice confluence to this level!
Price Action
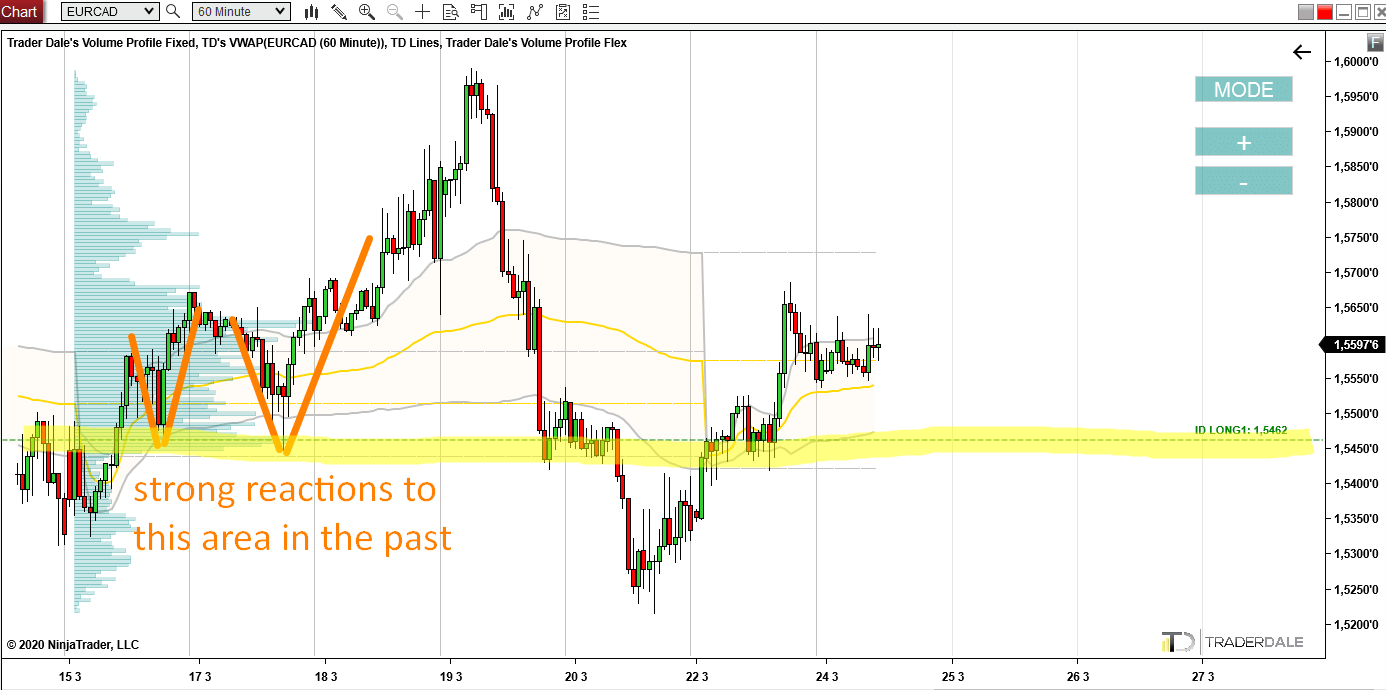
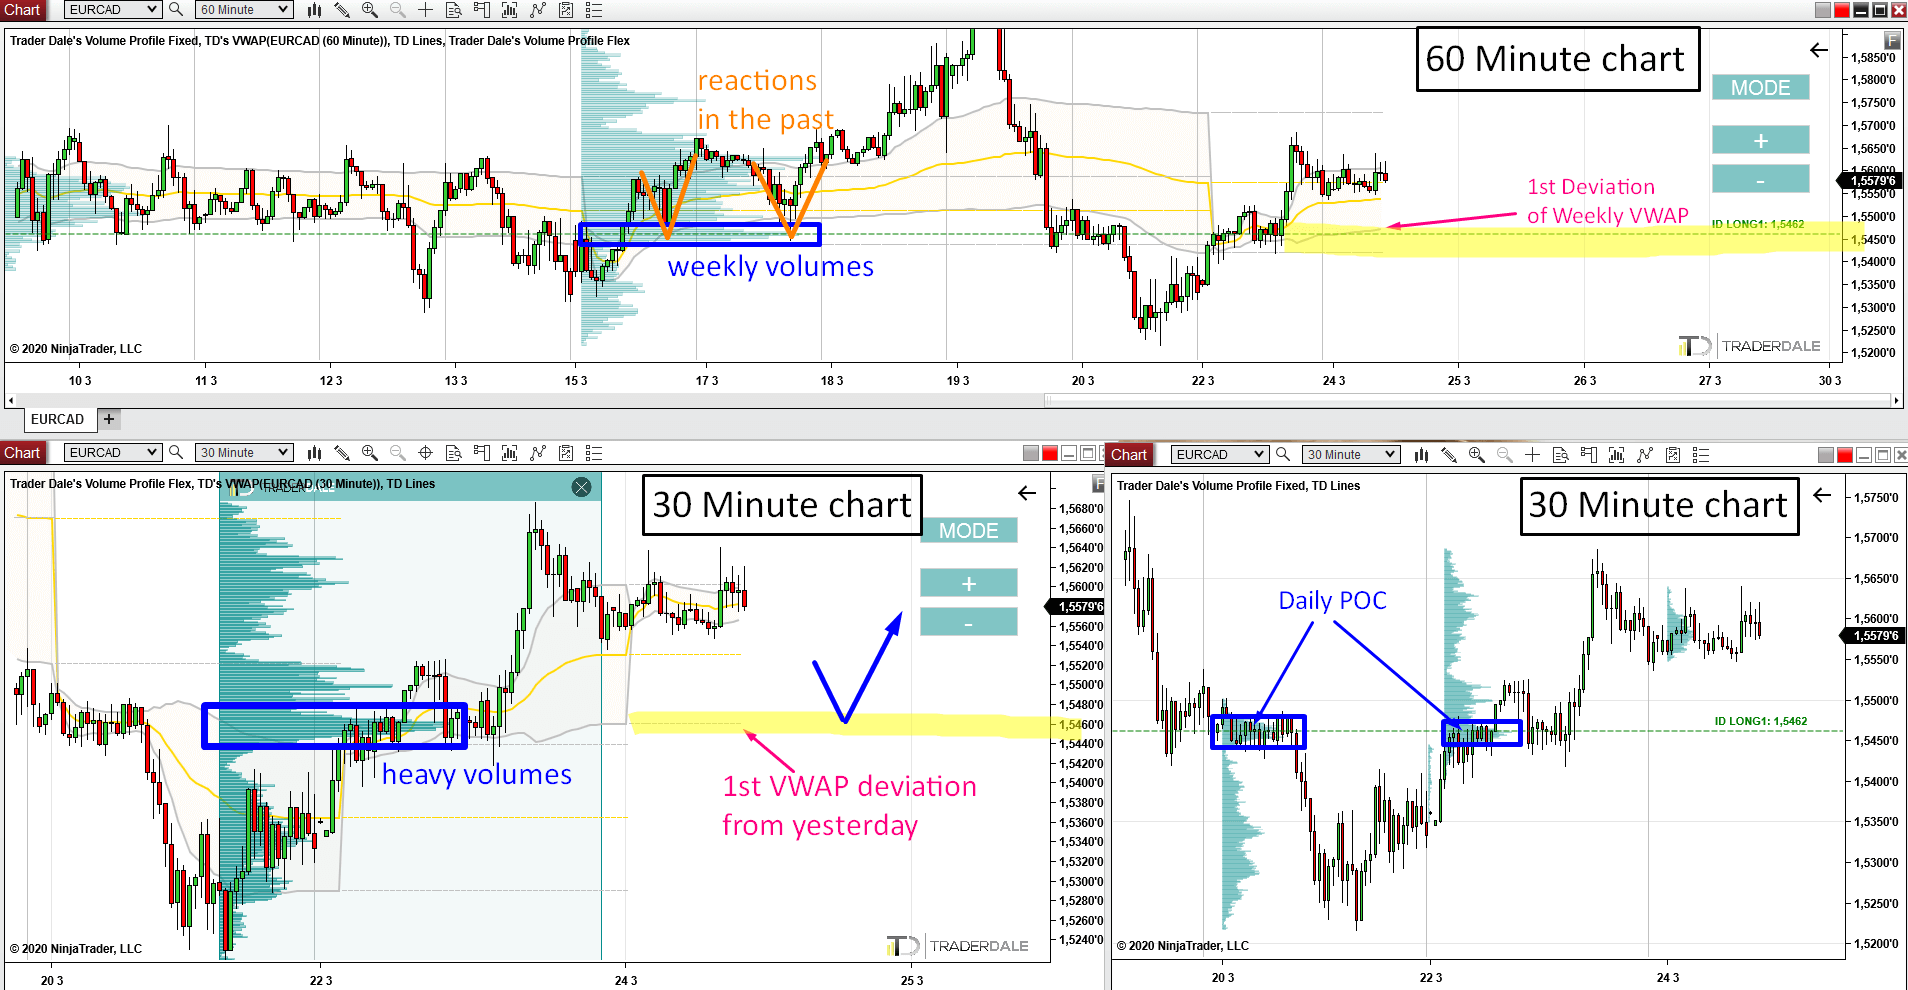
A small bonus to all that is that there were also two very nice reactions to this level in the past. I highlighted those reactions in orange. Such reactions mean that this level worked as a support in the past – therefore, it was an important level. This adds one more little confluence to the whole picture.EUR/CAD; 60 Minute chart:
Intraday trading workspace
Do you think it is too hard to track all this? It takes some experience but it is not that hard. Especially if you know what to look for. What helps is to have a nice (and clean) intraday workspace that shows you everything you need.What you see below is my intraday trading workspace. It consists of three charts and it shows all the things I was talking about in this article. Everything on just one screen.
I am not saying it takes just a quick look and I immediately see strong trading levels. It takes some thinking to find them, but having a workspace like this makes things way easier!
Don’t risk too much!
One important thing to wrap this up. Don’t risk too much on one single trade. No matter how many confluences, no matter how strong the level appears. No trading strategy has 100% win rate and there is always a risk of taking a losing trade. Losing trades are part of this business.You should be extra careful especially now when there is news coming up very often and the overall market volatility has risen dramatically.
I hope you guys liked today’s analysis. Let me know what you think in the comments below!
Stay safe and happy trading!
-Dale
Stay safe and happy trading!
-Dale
- Get link
- X
- Other Apps
- Get link
- X
- Other Apps
Hey, thanks for the information. your posts are informative and useful.
ReplyDeleteGanges Securities Ltd