The S&P 500 index is in a crazy sell-off since this Monday. The growth from the last three months was blown away just in three days and there is still no sign of stopping.
The other thing is that when there is a strong uptrend there are always pullbacks and also “Long squeezes”.
A Long squeeze is what I think we currently see on the S&P 500. Big trading institutions don’t want to be buying and adding to their long positions for too high prices. Big guys don’t want to buy expensive. What is best for them is simply manipulate the market into a sell-off like we see now and then buy for cheaper/lower prices later.
What do the other market participants do when they see a sell-off? They start to panic and sell their longs. This helps to drive the sell-off even more!
What do the big guys do next when the “weak buyers” are out? The big guys start buying again! But this time for much lower prices! It is as simple as that.
When do you think is the best time to start such a Long squeeze? When there is panic (Coronavirus,…). This makes the sell-off more scary and people are more prone to believe that they should really quit their long positions (they quit by selling them to institutional buyers).
There were so many cases like this in the past and I am quite sure this is not different.
What caused the sell-off?
One thing is fundamentals like the Coronavirus slowing down the global economy (-0.1 to -0.2% was the IMF optimistic estimate).The other thing is that when there is a strong uptrend there are always pullbacks and also “Long squeezes”.
A Long squeeze is what I think we currently see on the S&P 500. Big trading institutions don’t want to be buying and adding to their long positions for too high prices. Big guys don’t want to buy expensive. What is best for them is simply manipulate the market into a sell-off like we see now and then buy for cheaper/lower prices later.
What do the other market participants do when they see a sell-off? They start to panic and sell their longs. This helps to drive the sell-off even more!
What do the big guys do next when the “weak buyers” are out? The big guys start buying again! But this time for much lower prices! It is as simple as that.
When do you think is the best time to start such a Long squeeze? When there is panic (Coronavirus,…). This makes the sell-off more scary and people are more prone to believe that they should really quit their long positions (they quit by selling them to institutional buyers).
There were so many cases like this in the past and I am quite sure this is not different.
How do we profit on this?
Somebody might say that the best way how to profit on this sell-off is to enter shorts and make some money on the panic. I am not a fan of this because I think this is a Long squeeze (only a trap for buyers) and that the price will revert and go to new highs again.I think it would be best to act like an institution and ask ourselves – where are the institutions most likely to enter their longs again?
In my opinion, they will do it in a place where they think enough liquidity is. Big guys always need huge liquidity. And since big liquidity is where heavy volumes are (or were), we can use our favorite tool Volume Profile to identify such places.
In this case I used Daily chart and printed the Volume Profile over the uptrend area which started in 2019 and continued until the previous week.
Volumes in this area look like this:
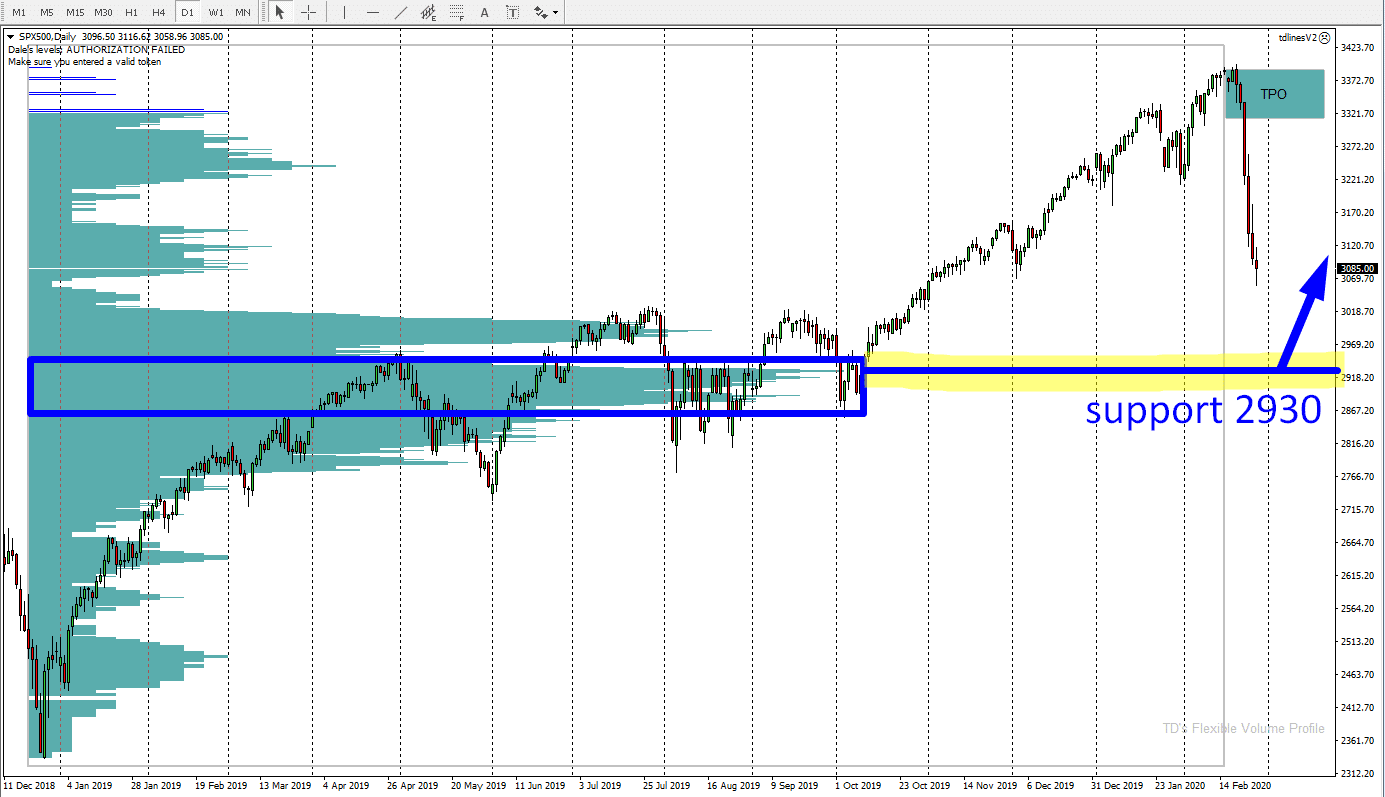
As you can see from the screenshot above there was a heavy volume area around the 2930.00. The heaviest volumes in the previous and this year got traded there.
I think this will be the zone the aggressive sellers will try to reach. Then I expect an end of the panic and a new start of buying activity.
I think this will be the zone the aggressive sellers will try to reach. Then I expect an end of the panic and a new start of buying activity.
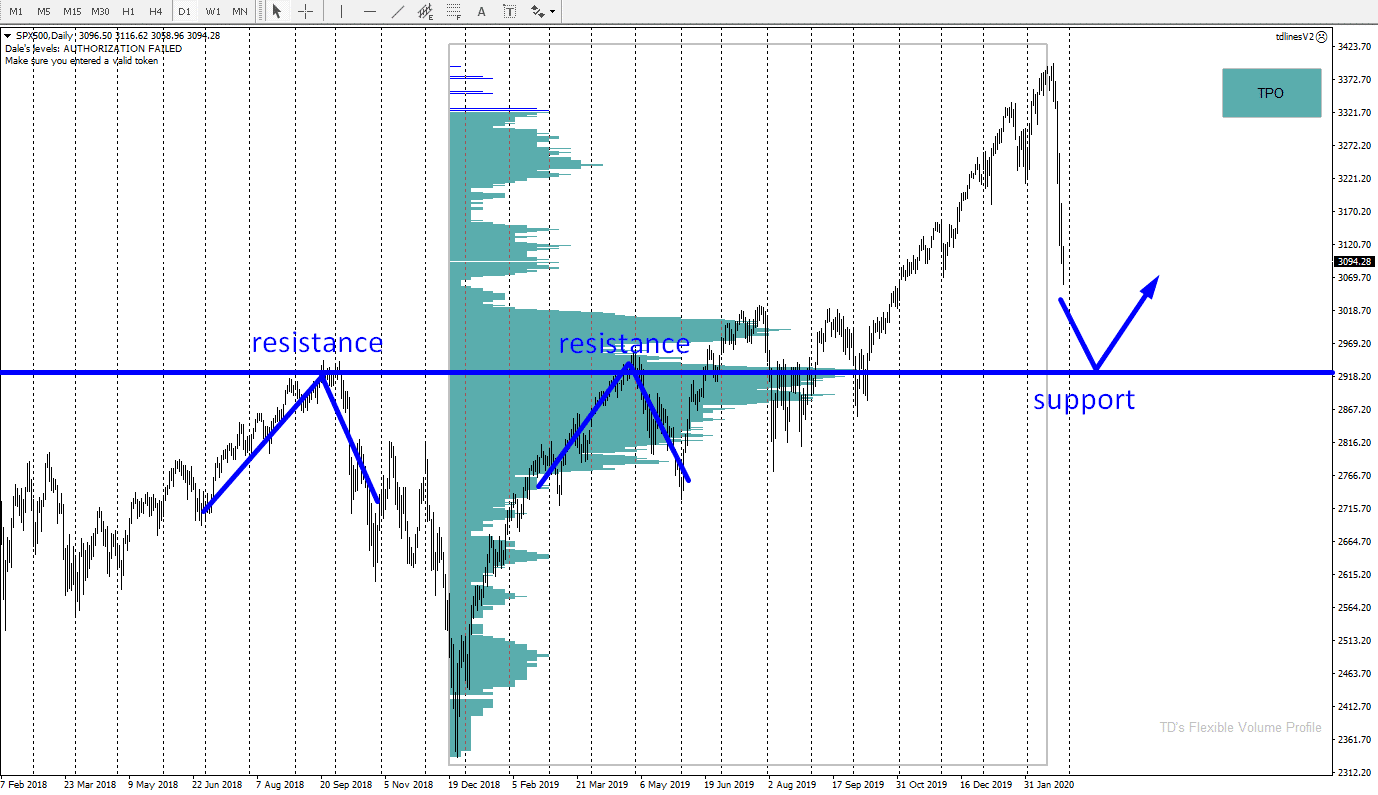
Resistance becoming Support
There is also one more thing (apart from the heavy volumes) which confirms this trading idea. The thing is that this zone around 2930.00 worked as a strong Resistance in the past. The price strongly bounced off this area twice. When the price went through this Resistance, then the Resistance became a Support.You can see this on the picture below. It is also a Daily chart, only zoomed out so we can see more into its history:
BTW if you would like to learn more about the Resistance becoming Support setup then go here:
EXPLAINED: Resistance becoming Support setup
EXPLAINED: Resistance becoming Support setup
I hope you guys liked this article! Let me know what you think in the comments below!
Happy trading!
-Dale
-Dale
- Get link
- X
- Other Apps
- Get link
- X
- Other Apps
Hey, thanks for the information. your posts are informative and useful.
ReplyDeleteGreaves Cotton Ltd