Trading Volume Clusters on ES (S&P 500 Futures)
Quite a lot of people like trading indices using the Volume Profile tool.
In my experience, the Volume Profile works fantastic with indices. In fact, I am also planning to add ES (SP 500 futures) to the levels which I publish daily for members of my Trading course.
So, today, I would like to have a closer look at the ES and show you my intraday trade analysis using Volume Profile there.
When I see an intraday uptrend like this, then I start to look for significant Volume Clusters formed within the uptrend.
Such Volume Clusters point to places, where the buyers who are pushing the price upwards were adding to their buying positions.
So, when I used my Flexible Volume Profile to look in the trend area, then it showed me this:
*ES 03-20; 30 Minute chart:
In my experience, the Volume Profile works fantastic with indices. In fact, I am also planning to add ES (SP 500 futures) to the levels which I publish daily for members of my Trading course.
So, today, I would like to have a closer look at the ES and show you my intraday trade analysis using Volume Profile there.
Let’s look for some Volume Clusters!
There was a strong buying activity on Monday and buyers were pushing the price upwards.When I see an intraday uptrend like this, then I start to look for significant Volume Clusters formed within the uptrend.
Such Volume Clusters point to places, where the buyers who are pushing the price upwards were adding to their buying positions.
So, when I used my Flexible Volume Profile to look in the trend area, then it showed me this:
*ES 03-20; 30 Minute chart:
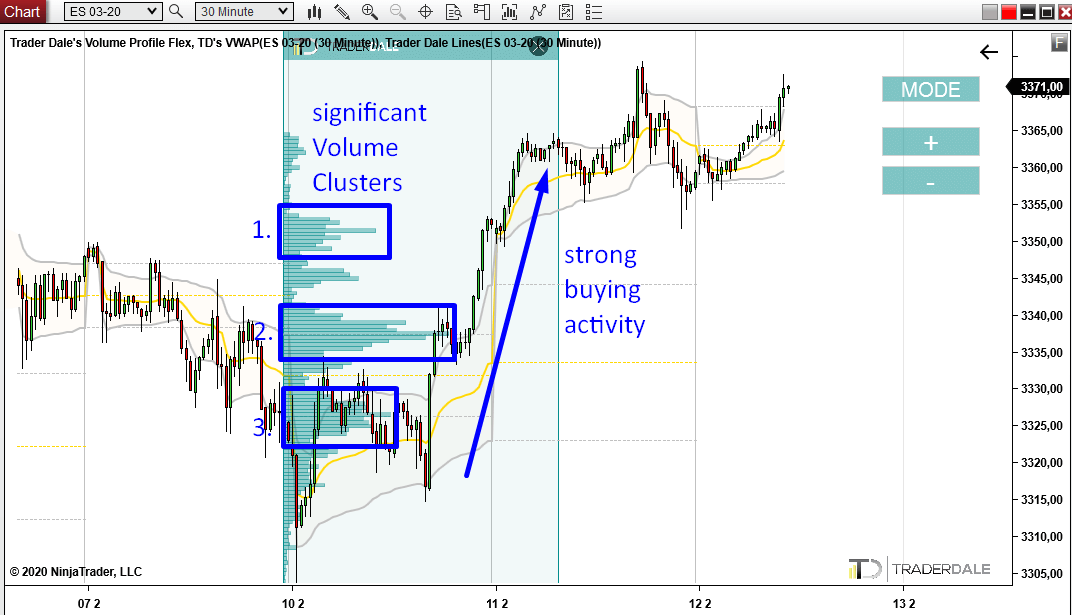
In the picture above, you can see three significant Volume Clusters. Those were the places buyers used to accumulate their buying positions.
Let’s now have a look at those Volume Cluster one by one!
Let’s now have a look at those Volume Cluster one by one!
1st Volume Cluster (3351.50)
The first Volume Cluster got formed at the break of day – Monday and Tuesday. There was a nice little rotation and heavy volumes got traded there.Two hours before the market close on Tuesday, this level got tested. There was a sharp and precise reaction to it.
Because the price already touched this level and reacted to it, I consider it a tested level. For this reason I will discard it and I won’t trade it anymore. Chances for another reaction are lower now.
*ES 03-20; 30 Minute chart:
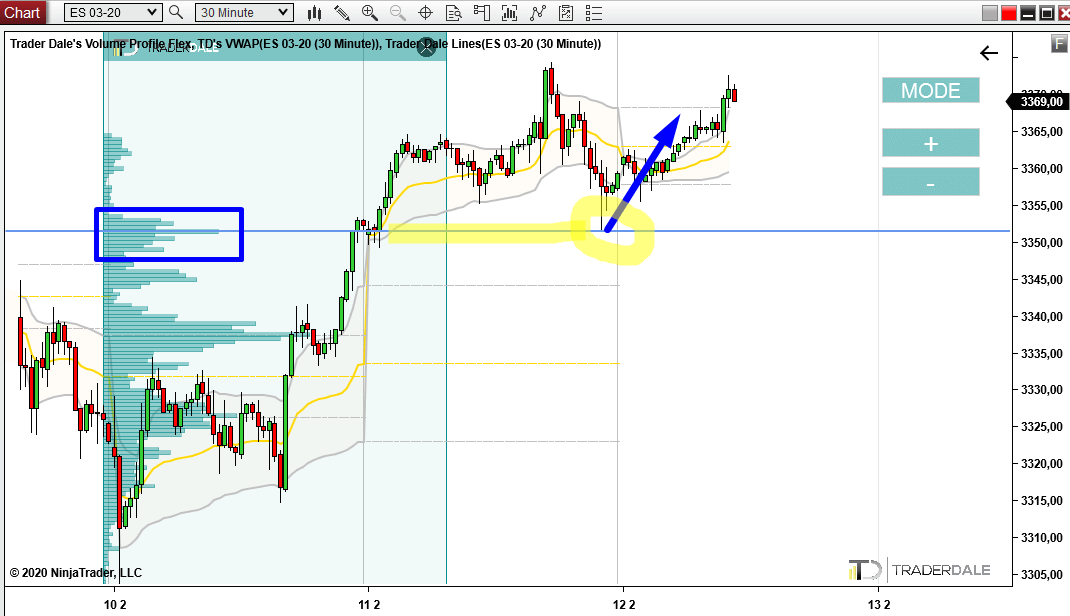
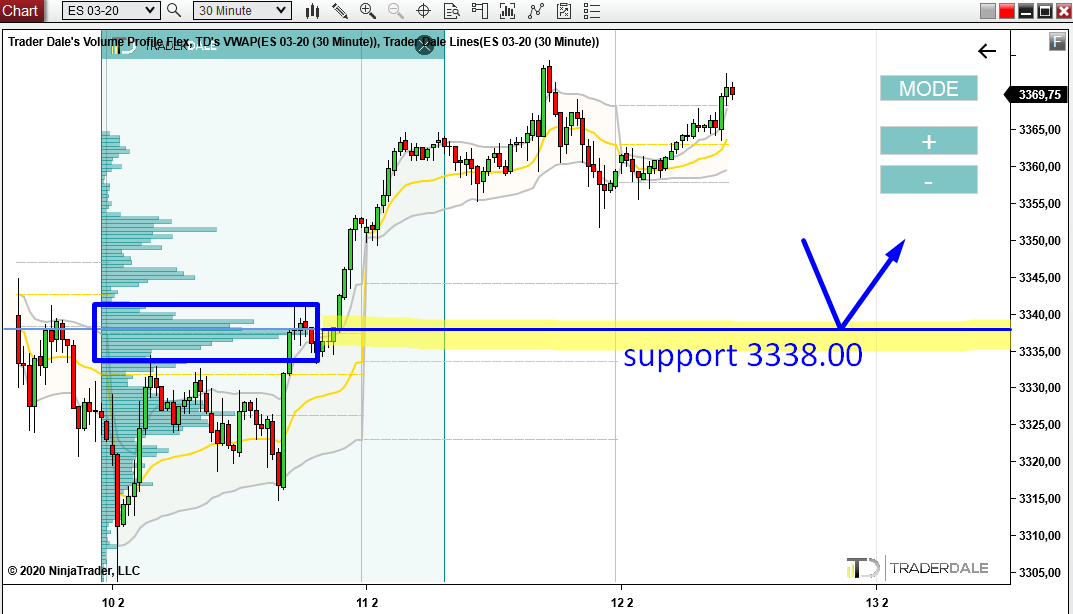
2nd Volume Cluster (3338.00)
Out of the three Volume Clusters I like this one the most.As you can see, the volumes in this Volume Cluster are really nicely visible and the level is very clear and easy to see.
Most of the buyers from this uptrend were adding to their positions at this place.
What I expect now is that when the price makes it back to this level again sometime in the future, those buyers will become active again and they will start pushing the price upwards again.
This does not need to happen today or tomorrow, not even this week! Markets have good memory, so even if this level gets hit in 2-3 weeks I will still believe in a buying reaction from there.
*ES 03-20; 30 Minute chart:
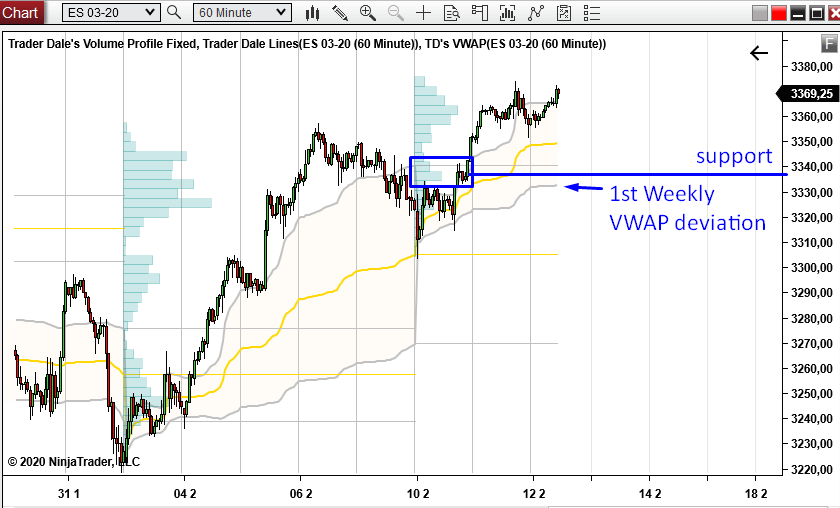
2nd Volume Cluster – VWAP confluence
What I also like about the 2nd Volume Cluster is that it is in confluence with 1st deviation of Weekly VWAP!It is the grey line I marked in the picture below.
Right now this line is little bit below my support, but it is still moving and slowly heading upwards. Chances are that when the price re-visits this support again, this 1st VWAP deviation will be somewhere around.
*ES 03-20; 60 Minute chart:
3rd Volume Cluster
the last Volume Cluster was created before the beginning of the uptrend.Funny thing is that the heaviest volumes within this uptrend were not accumulated there (they got accumulated at the 2nd volume cluster).
Usually it is not like this! Usually the heaviest volumes are placed before the big move starts.
I don’t think this is anything we should be concerned too much about, but I think it is an interesting thing worth noticing.
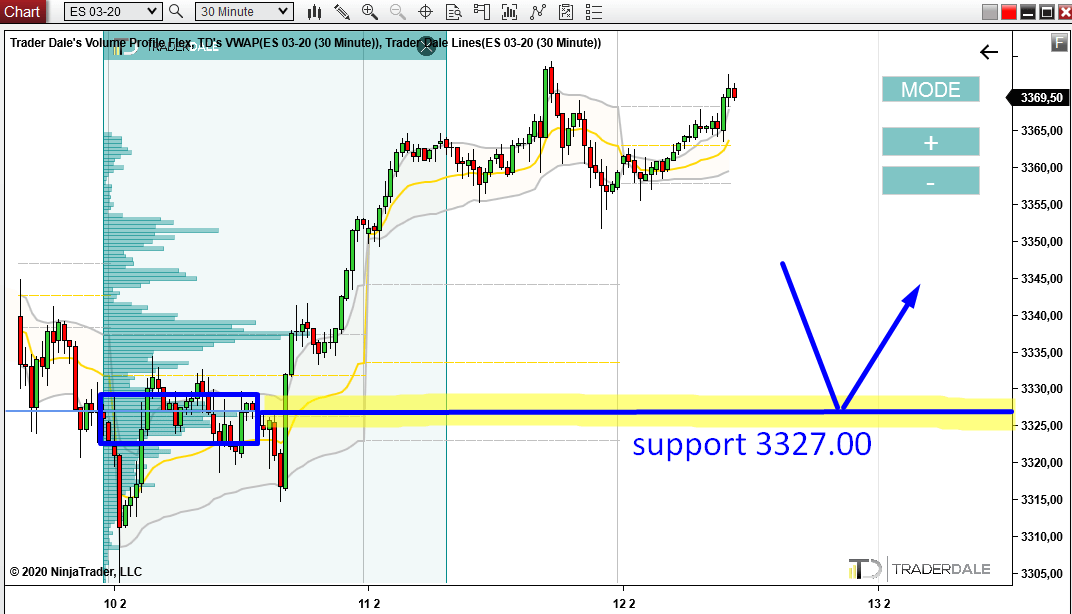
So, what happened here was that buyers were building up their buying positions (around 3327.00). It took them around half a day. Than they started placing aggressive buy market orders which started to push the price upwards into the trend.
When the price gets back to this level again, I expect that those strong buyers who initiated this whole buying activity will become active again and that they will try and push the price upwards from this level again.
That’s how I currently see the ES.
I hope you guys liked the analysis. Feel free to leave a comment below.
I hope you guys liked the analysis. Feel free to leave a comment below.
Happy trading!
-Dale
-Dale
- Get link
- X
- Other Apps
- Get link
- X
- Other Apps
Comments
Post a Comment