NZD/CAD: Intraday Analysis from A to Z
Today, I am going to do a complete intraday analysis on NZD/CAD. I am going to show you the way I always do it from A to Z.
If there is a rotation then I am looking for both buying and selling opportunities (longs and shorts).
When there is a trend, then I am looking only for trades which are in line with the trend.
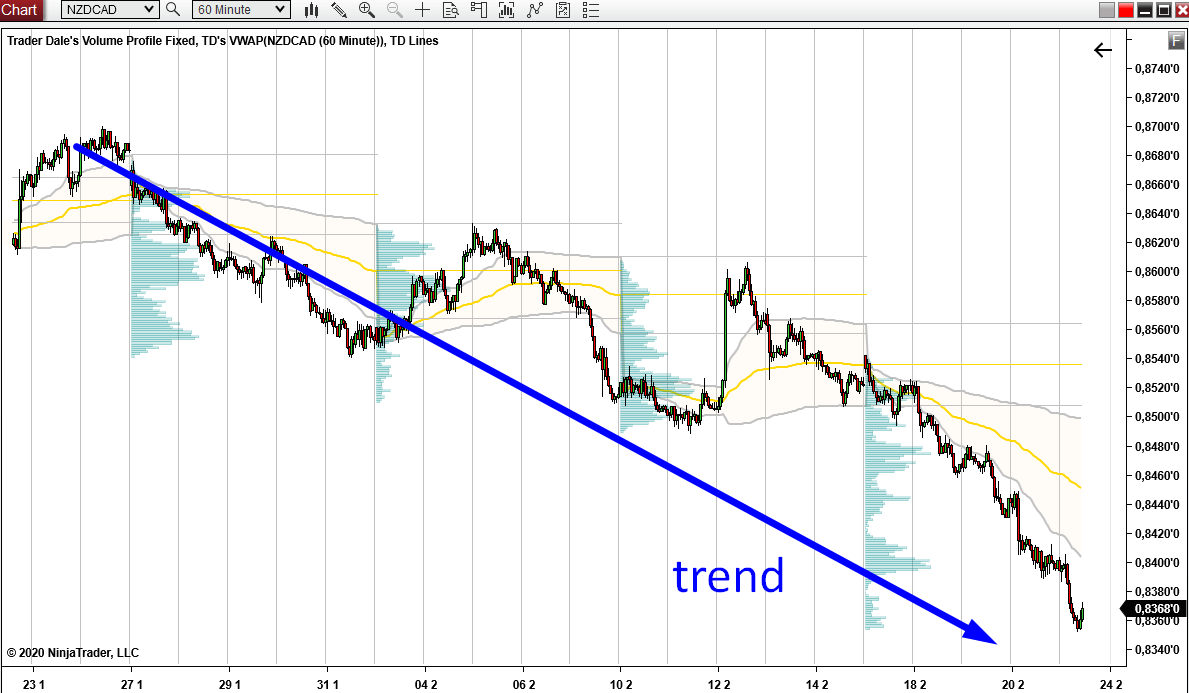
NZD/CAD is clearly in a downtrend, so I will be looking for short trades only.
NZD/CAD; 60 Minute chart:
Rotation vs. Trend
The first thing I check is whether there is a trend or a rotation.If there is a rotation then I am looking for both buying and selling opportunities (longs and shorts).
When there is a trend, then I am looking only for trades which are in line with the trend.
NZD/CAD is clearly in a downtrend, so I will be looking for short trades only.
NZD/CAD; 60 Minute chart:
Weekly Volume Profiles
After I decided whether I look for longs, shorts, or both I look into Weekly Volume Profiles.Those should point me to the strongest intraday supports and resistances.
If an intraday support/resistance is clearly visible on the Weekly Volume Profile, then the chances of a successful reaction to it are higher.
Why? Because even those traders who trade bit higher time frames will be interested to trade these volume support/resistances. In other words – such trading levels attract more traders – for example, intraday traders using 15-minute charts as well as swing traders using 1-hour charts.
So, if a level is visible on the bigger picture, then chances of success are bigger.
Weekly VWAP
The next thing I check is the Weekly VWAP and its Deviations. Actually, it is the Deviations that interest me the most.Deviations have many functions. The first function is that they show whether there is a trend or a rotation. If there is a trend (like in this case) they point me to places where the price could make pullbacks.
In a downtrend, the price usually moves below 1st Deviation and reacts to it from below.
As you can see in the picture below, the price already made some reactions to it this week. If the price hits the 1st Deviation again, there could be another reaction.
NZD/CAD; 60 Minute chart:
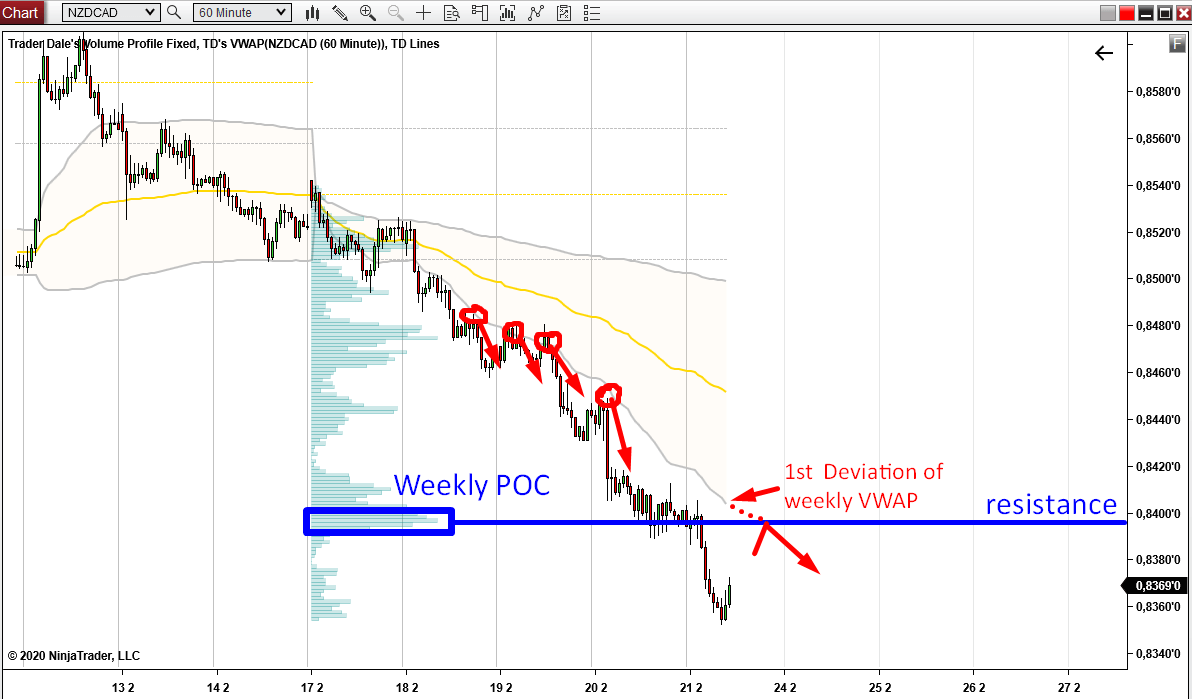
Weekly Profile + VWAP confluence
If you look at the picture above, then you can see that there is a nice confluence of two trading signals.The confluence is that the 1st Deviation is almost at the Weekly POC (the place where the heaviest volumes throughout this week were traded). I think that chances are that the 1st Deviation will actually get there in a couple of hours.
Such confluence marks a really nice resistance level.
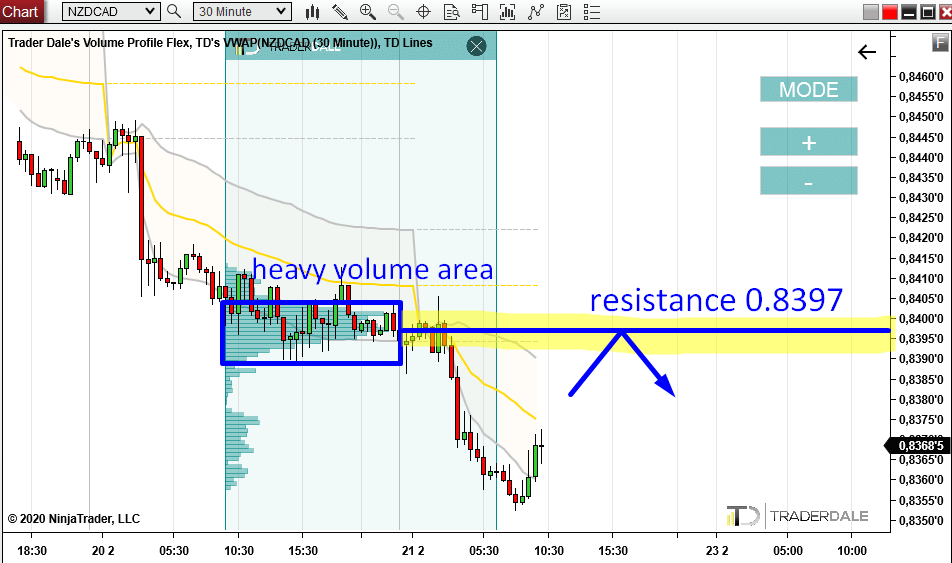
In a case like this, I switch to a lower time frame to see where exactly the resistance is and what exactly happened in this area
Detailed Flexible Volume Profile analysis
Now I switch from 60 Minute to 30 Minute time frame.There is a nice rotation with heavy volumes accumulated in this area.
I call this the Volume Accumulation Setup and you can learn more about it here:
Volume Accumulation Setup EXPLAINED
This tells me that there was a rotation in which sellers were building up their selling positions. Then they started selling again and pushed the price lower.
When there is a pullback into this area, chances are that those sellers will become active again and they will try to push the price downwards.
The heaviest volumes in this rotation were at 0.8397. This means that the sellers placed most of their positions there. For that reason this price level is the most important level for them.
Summary
In the end I came up with an intraday trading resistance at 0.8397.Reasons:
1. Downtrend (I want shorts)
2. 1st Deviation of VWAP
3. Weekly POC
4. Intraday trading setup on 30 Minute chart
All those 4 points are in line with each other point to the 0.8397 resistance.
Does this mean it will surely work? Absolutely not!
In trading even the best resistance or support can fail. We as traders must accept that there is no way we can be right in 100% of the cases. In fact I consider an experienced pro trader whoever is able to maintain 60% win rate in the long run. If you manage that, then congratulations, you are a winner in this game!
I hope you guys liked my analysis. Let me know what you think in the comments below!
I will be looking forward to see you on Monday with Weekly Trading Ideas Video!
I will be looking forward to see you on Monday with Weekly Trading Ideas Video!
Happy trading!
-Dale
-Dale
- Get link
- X
- Other Apps
- Get link
- X
- Other Apps
Comments
Post a Comment