There was significant macro news concerning the AUD released on Tuesday. It was the AUD Cash Rate and RBA Rate Statement. This macro affected all the AUD related forex pairs.
Today, I would like to show you the AUD/JPY. In here, the macro completely changed the overall trend!
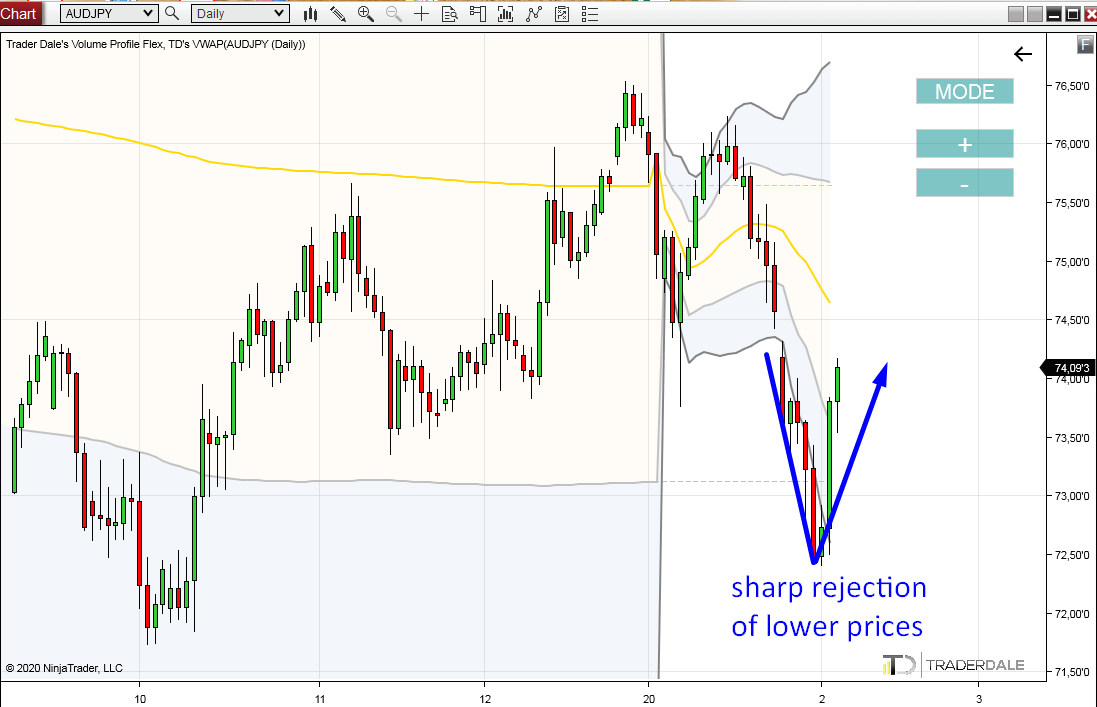
You can see this nicely on a Daily AUD/JPY chart:
A change in sentiment
There was a downtrend and now the price has made a sharp rejection of lower prices. Aggressive buyers are currently pushing the price upwards.You can see this nicely on a Daily AUD/JPY chart:
If you switch from Daily time frame to 30 Minute time frame, then you can start looking for some intraday buying opportunities, to participate in the current buying activity.
Best way to do so, is to use the Flexible Volume Profile to identify significant heavy volume areas.
Best way to do so, is to use the Flexible Volume Profile to identify significant heavy volume areas.
The picture below shows what the Volume Profile in this area looks like.
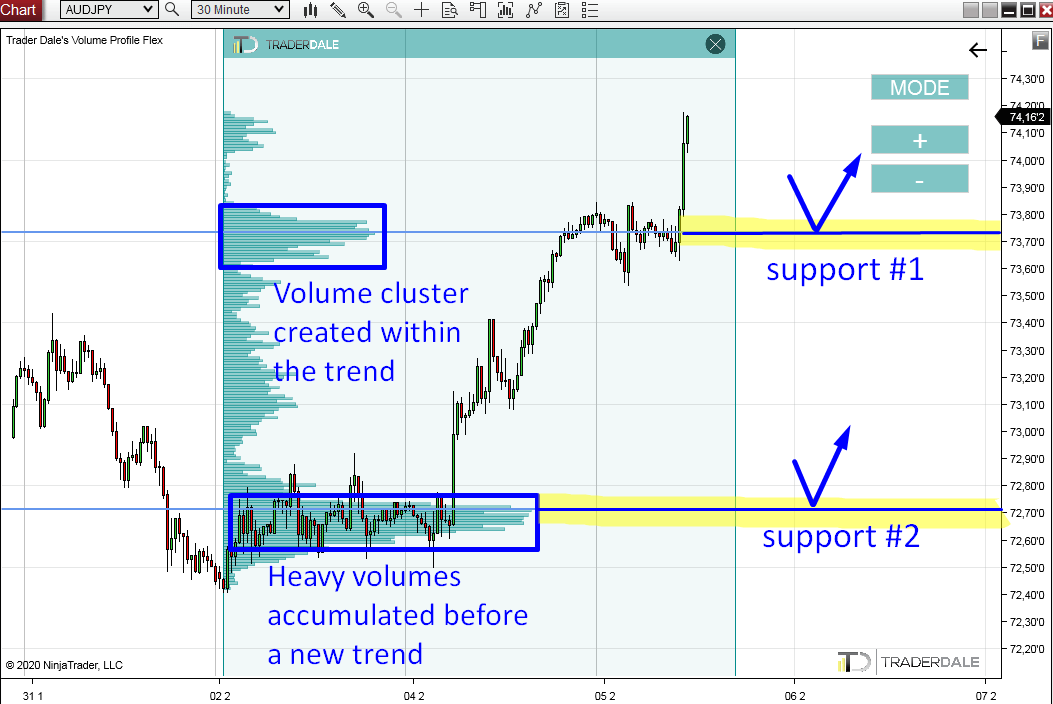
It reveals two heavy volume zones. First is around 73.74, and the second is around 72.72
Then there was the macro news and those buyers started buying again, but this time much more aggressively.
This started to drive the price upwards.
When the price makes it back to this area sometime in the future (this can take a while but we can wait), then I expect those buyers will become active again, and they will try and push the price upwards again. At least temporarily.
This could create a nice buying opportunity.
This one was created by buyers who were adding to their buying positions.
As you can see, the price stopped for a while to rotate. This Volume Cluster was created within a rotation.
The buyers used the rotation to add some more to their buying positions. When they did so, they started pushing the price upwards again. This is the buying activity we see right now.
What I expect to happen is this: When the price makes a pullback to this Volume Cluster again, those buyers who were adding to their buying positions there (around 73.74) will try and push the price upwards again. They will do so, because they will try to defend their long positions.
Support around 72.72
What happened here is that buyers were accumulating their buying positions in the lower area (around 72.72).Then there was the macro news and those buyers started buying again, but this time much more aggressively.
This started to drive the price upwards.
When the price makes it back to this area sometime in the future (this can take a while but we can wait), then I expect those buyers will become active again, and they will try and push the price upwards again. At least temporarily.
This could create a nice buying opportunity.
Support around 73.74
The other significant volume area the Flexible Volume Profile shows is a Volume Cluster, created around 73.74.This one was created by buyers who were adding to their buying positions.
As you can see, the price stopped for a while to rotate. This Volume Cluster was created within a rotation.
The buyers used the rotation to add some more to their buying positions. When they did so, they started pushing the price upwards again. This is the buying activity we see right now.
What I expect to happen is this: When the price makes a pullback to this Volume Cluster again, those buyers who were adding to their buying positions there (around 73.74) will try and push the price upwards again. They will do so, because they will try to defend their long positions.
How the sellers will react
Also, sellers will be cautious when those two heavy volume areas get hit again. The reason is that they will know there were aggressive buyers there. They won’t care too much to risk a potential fight with them.So, it is likely that sellers will get rid of their short positions when the price re-visits those areas again.
How does a seller get rid of a short position? He buys!
This helps the buyers push the price upwards again.
More opportunities
There are currently more trading opportunities like this on some other AUD related forex pairs. All thanks to the RBA macro news.They are not too hard to find (well, you need to have Volume Profile, otherwise they ARE hard to find). So maybe you could give it a try and find some more yourself!
P.S. The setups I used today are described more in detail in this FREE Volume Profile webinar:
Volume Profile setups webinar
Happy trading!
-Dale
-Dale
- Get link
- X
- Other Apps
- Get link
- X
- Other Apps
Comments
Post a Comment